Explainer - M8.8 Kamchatka Russia Earthquake and Tsunami
On Wednesday 30 July at 11:25am (New Zealand Time) a magnitude 8.8 earthquake occurred off the east coast of Kamchatka in the far east of Russia. We take a look at the impacts one of the largest earthquake events recorded, on modern seismic equipment, had on Aotearoa New Zealand.
The earthquake
The first global earthquake information available underestimated the earthquake size (M8.0), as is very common with these large events. Big earthquakes are always difficult to analyse quickly because they require a lot of data and sophisticated modelling to get a handle on them. At M8.0 we weren’t concerned about a tsunami threat for New Zealand. But when this was revised to M8.7 (later M8.8 - nearly 10 times more energy than a M8.0!), we quickly reassessed and realised there was a real possibility of a tsunami heading for our shores.
The earthquake was a megathrust rupture – a massive earthquake that occurs at a subduction zone where one tectonic plate slides beneath another. The 2011 Tohoku-Oki and 2004 Indian Ocean earthquakes are notable examples of recent megathrust earthquakes.
Megathrust earthquakes can produce large tsunami, and this earthquake is no different. However, the tsunami has been less damaging than some models predicted due to the earthquake slip (around 11 metres according to our experts) being focused at greater depths on the subduction interface (the megathrust fault) than was initially expected.
When slip occurs deeper on the megathrust – on this occasion around 25 km deep – there is less seafloor displacement, which in turns means a smaller tsunami. Deeper slip tends to cause less intense shaking – fortunate for those close to the rupture!
The tsunami
Soon after the earthquake, a tsunami was observed by the real-time deep ocean tsunami monitoring systems, known as DART buoys, located in the North Pacific Ocean.
Our scientists jumped into action and analysed these data to make a model of the tsunami source. It was quickly obvious that this earthquake produced a smaller tsunami than a more typical M8.8 megathrust earthquake but still substantial and of long duration over several days.
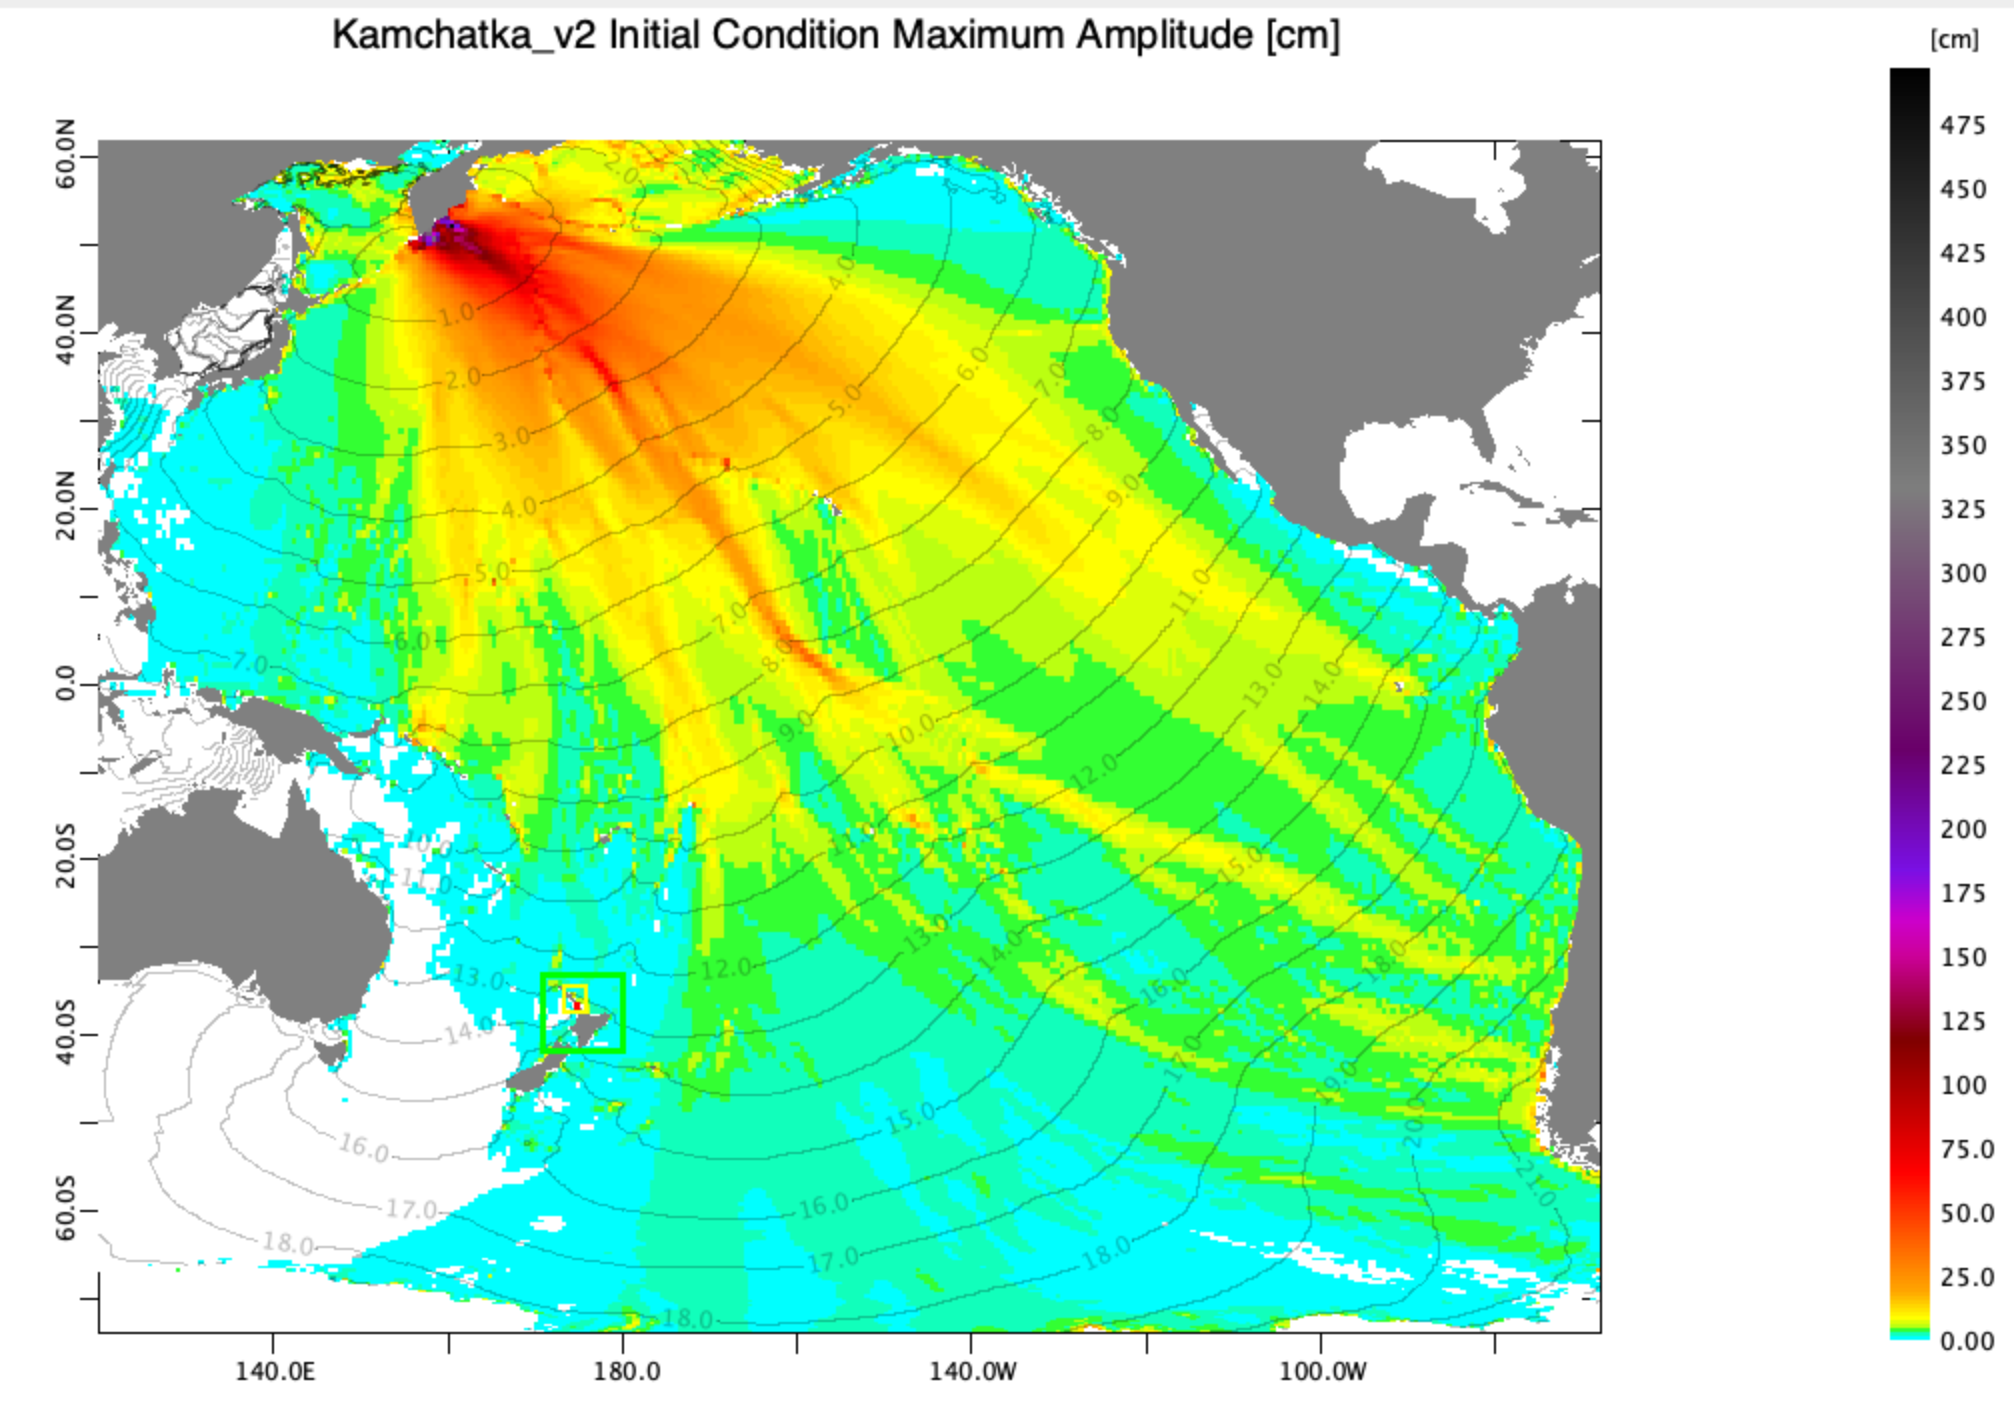
Earth Sciences New Zealand deep-ocean tsunami amplitude forecast map showing pattern of tsunami energy distribution across the Pacific Ocean. Note amplitudes are much smaller than at coasts, where wave shoaling makes them much higher.
Some parts of the Pacific experienced waves up to 3-5 metres high and more than two million people were evacuated from the shore. However, the damage has been reported as relatively minimal for an earthquake event this size.
This tsunami wave travelled more than 10,000 kms over the next 13.5 hours to reach New Zealand shores.
NEMA issued a national tsunami advisory for New Zealand advising that New Zealand coastal areas could experience strong and unusual currents and unpredictable surges at the shore.
Fortunately for New Zealand, the waves arriving at our coasts did not require evacuation, with the largest recorded wave – 55 cm – striking the Chatham Island coast shortly after 6 am. That is not to say a small tsunami doesn’t come without its dangers.
New Zealand’s coastline is vast and complex, and Kiwis are often in or on the water at all hours across the motu. A 10-50 cm tsunami might not sound like much, but that small tsunami can move a lot of water. What’s more, these strong tsunami surges may not be obvious from the shore. That’s why it’s vital to alert the wide range of people who visit these areas to avoid activities like swimming, wading, or out in small boats while tsunami surges are still occurring.
Read our full story on why you should still stay well away from the shore when a small tsunami is on its way.
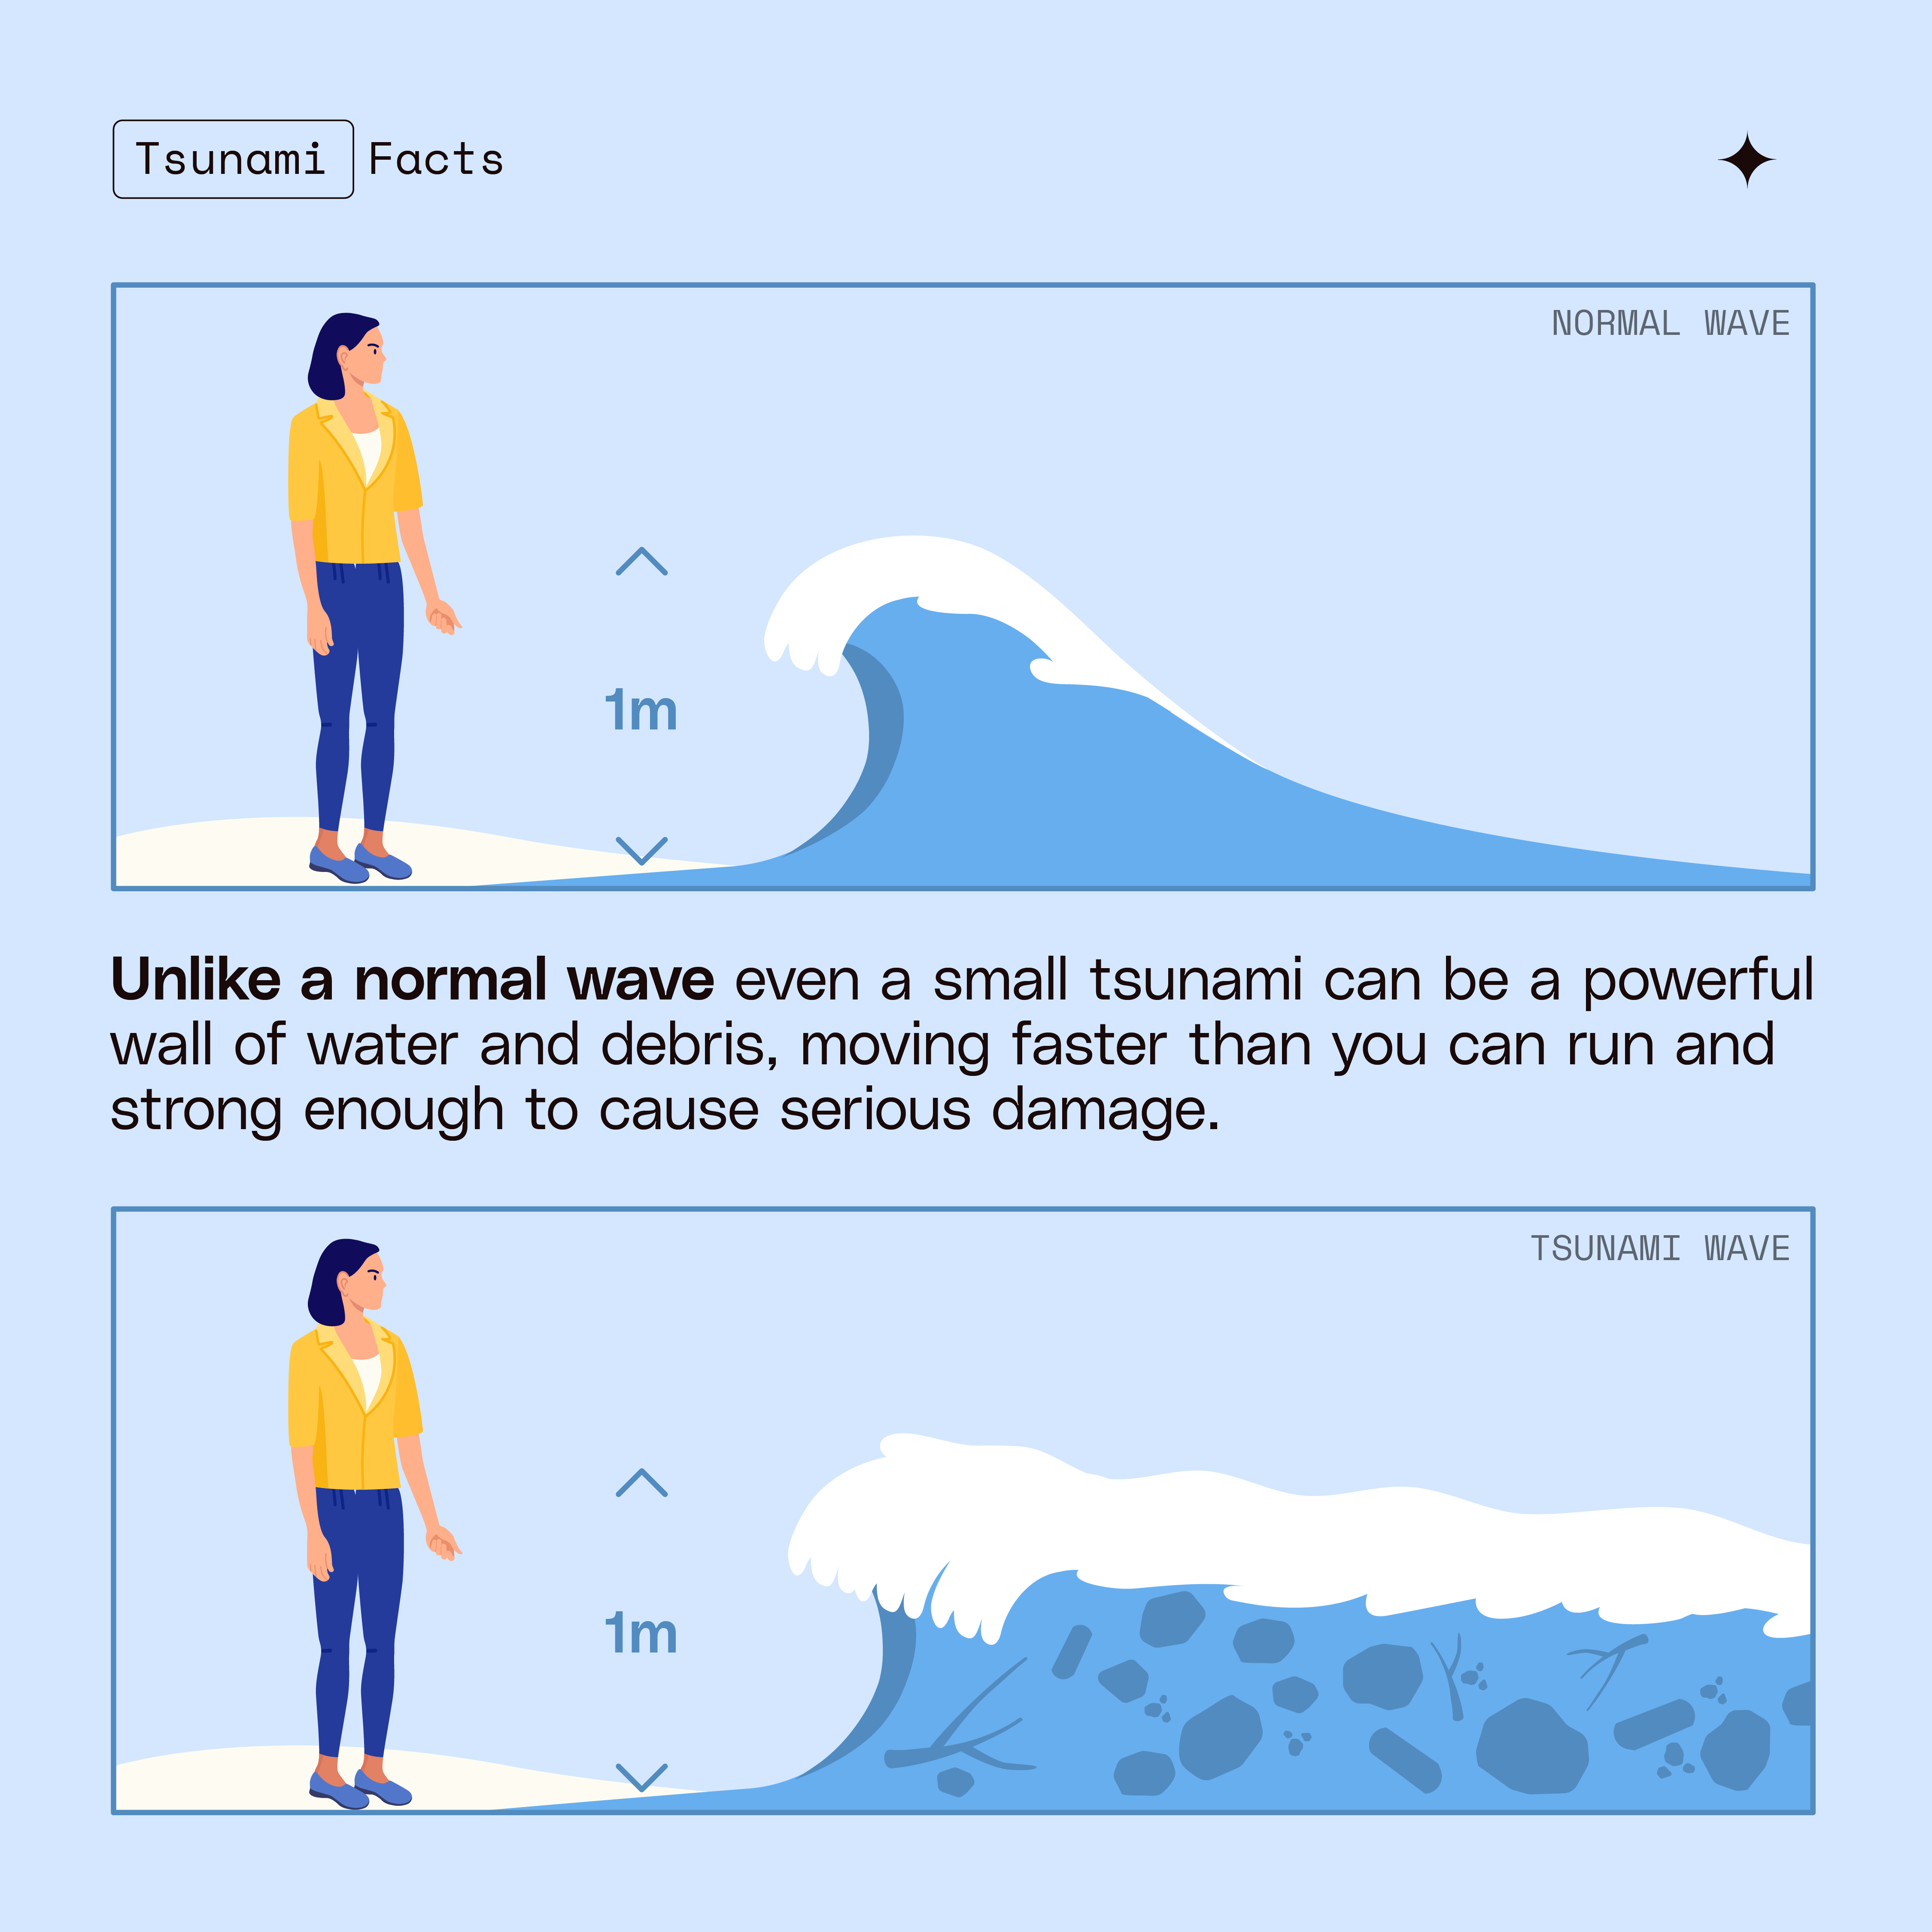
Unlike a normal wave even a small tsunami can be a powerful wall of water and debris.
What our instruments showed
The first of New Zealand’s instrument network to pick up the tsunami was the NZI DART buoy (deep ocean tsunami detector) south of Samoa at 9.20pm. This was four hours ahead of the first wave to reach the mainland, offering our tsunami experts more data to refine their estimates and provide the best possible advice to emergency managers.
Below is an account of how the tsunami wrapped around the country on 31 July on our Tsunami Gauge Network.
- The first wave arrival at the shore was detected at 1am, 31 July on the North Cape tsunami gauge.
- This wave proceeded down the country over the course of the next 90 or so minutes, varying in intensity at different parts of the shoreline.
- The largest amplitude arrival was seen on the Chatham Islands, 55cm, at 06:17 am.
- The largest mainland arrival was 31cm at Gisborne at 08:20 am.
- The smallest arrival was about 10cm across a number of gauges around the country.
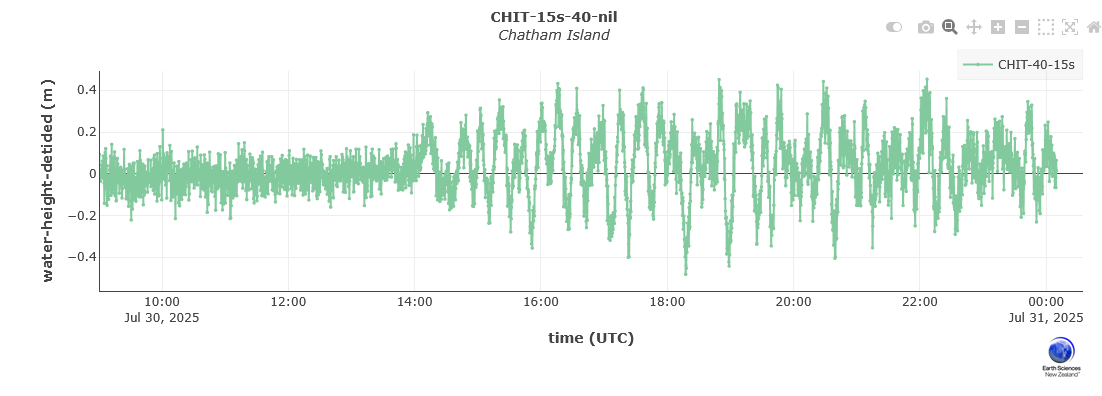
Tsunami arrival at Chatham Islands from 2am-12pm reaching maximum amplitude of 55 cm.
Residual tsunami – the first wave /s aren’t always the biggest
While the country saw a reduction in the tsunami energy on Thursday afternoon, it wasn’t over yet. Reflected tsunami waves off South America were seen from around midnight. For the Chatham Islands, the reflected wave was actually 15 cm bigger than the initial wave on Thursday, measuring 70cm on our tsunami gauge.
The tsunami continues to evolve as the tsunami energy is bounced around the Pacific (at the grand scale) and our coastal environments (at the “small” scale). Most of this evolution occurs as a loss of energy over time, but as reflections arrive from across the Pacific, the tsunami at our coasts are injected with energy and increase again in intensity before finally dissipating in full.
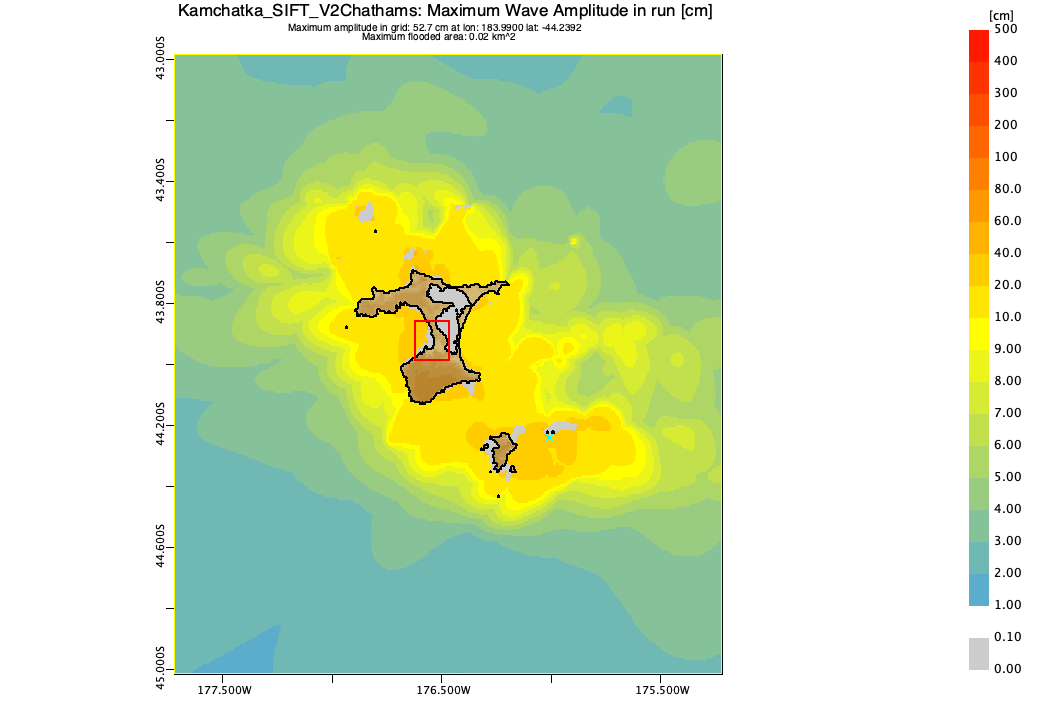
Earth Sciences New Zealand deep-ocean tsunami amplitude forecast map showing pattern of tsunami energy distribution across the Chatham Islands
How our advanced homegrown tsunami tools painted a rapid picture for New Zealand
We have been advancing our rapid earthquake and tsunami toolkit over the last five years through the Rapid Characterisation of Earthquake and Tsunami (RCET) programme. This proved invaluable in supporting the tsunami response, as we were able to turn these tools that we’d developed for New Zealand to the Kamchatka earthquake.
We first knew the earthquake was likely bigger than the reported 8 magnitude when our first RCET analysis tool used the earthquake duration to adjust magnitude estimates upward to M8.5, calculated 8 minutes after the origin. The tool also indicated a tsunami had very likely been generated, grabbing our attention very quickly. However, the precise magnitude of the earthquake, and the threat to New Zealand was still unclear.
When the tsunami hit the first DART buoys in the North Pacific Ocean, our suspicions were confirmed and we used this valuable data and new techniques and tools developed under RCET to create a ‘tsunami source model’ – a detailed picture of the way the tsunami was generated, which allowed us to create forecasts for New Zealand telling us how big the waves would be, when they would arrive and how they will envelop the coastline.
We now knew for this particular earthquake, the tsunami would be similar to a typical M8.6 subduction earthquake – still big, but a bit smaller than the typical M8.8 earthquake. This discrepancy might not seem like much but a 0.2 increase in magnitude represents a noticeable increase in energy release.
Our tools were used by the Tsunami Expert Panel to ensure we had accurate tsunami forecasts early in the response. This allowed us to make robust estimates of the severity and understand the long duration of the threat to New Zealand. Our ‘time-dependent forecasts’ – made over 7 hours before waves arrived in New Zealand – informed us that reflected waves from the Americas meant that the duration of the threat, particularly for some places on the East Coast and Chatham Islands would last through the early morning hours on Friday.
Did you see anything?
Did you see any heightened wave activity at the coast? Let us know by filling out this quick survey!
Learn: About tsunamis, learn the warning signs and the right action to take
Find: Your tsunami evacuation zone
Read: A tsunami isn’t just a big wave
We can’t prevent natural hazards, but we can, and should, be prepared for them
Remember Long or Strong, Get Gone : If you are near the coast, or a lake, and feel a strong earthquake that makes it hard to stand up OR a weak rolling earthquake that lasts a minute or more move immediately to the nearest high ground or as far inland as you can, out of tsunami evacuation zones.
For information on preparing for earthquakes or tsunami, there are guidelines from the National Emergency Management Agency's (NEMA) Get Ready website.
NEMA are the official source of tsunami warning information in New Zealand.
Prepare your home. Protect your whānau. There’s a lot we can do to make our homes safer and stronger for earthquakes. Natural Hazards Commission Toka Tū Ake's website has key steps to get you started.