Improvements to earthquake plots for the volcano team arrive on the GeoNet website
Much of the information and tools that our duty teams use is exactly the same as what you see on the GeoNet website. The volcano team have recently updated the way they view earthquakes near our active volcanoes, resulting in a new look for earthquake data
Several datasets are needed to monitor an active volcano. One of the most informative is the location of nearby earthquakes. GeoNet operates a dense network of seismic sensors near our active volcanoes and these are integrated into the National Seismic Network. Data from all the seismic sensors is processed as one dataset to locate earthquakes in New Zealand. This is a very efficient system and gives our volcano team lots of quality seismic data. Once we have all these data we need useful and informative ways to display it; so that we can easily see earthquake sizes, location and depths, and how they change through time.
The revised earthquake web page for each volcano has the familiar epicentre plot or map showing earthquake locations. The map shows the reviewed status of each earthquake, its magnitude and ‘age’ (up to 8 weeks before present), and you can also click on each earthquake to see more information about it.
This standard epicentre location map is now enhanced with cross-sections to show the depth of the earthquakes. All the symbols are colour coded to show when the earthquake occurred in the previous 8 weeks. In addition, the cross-sections scale with the map as you zoom in or out.
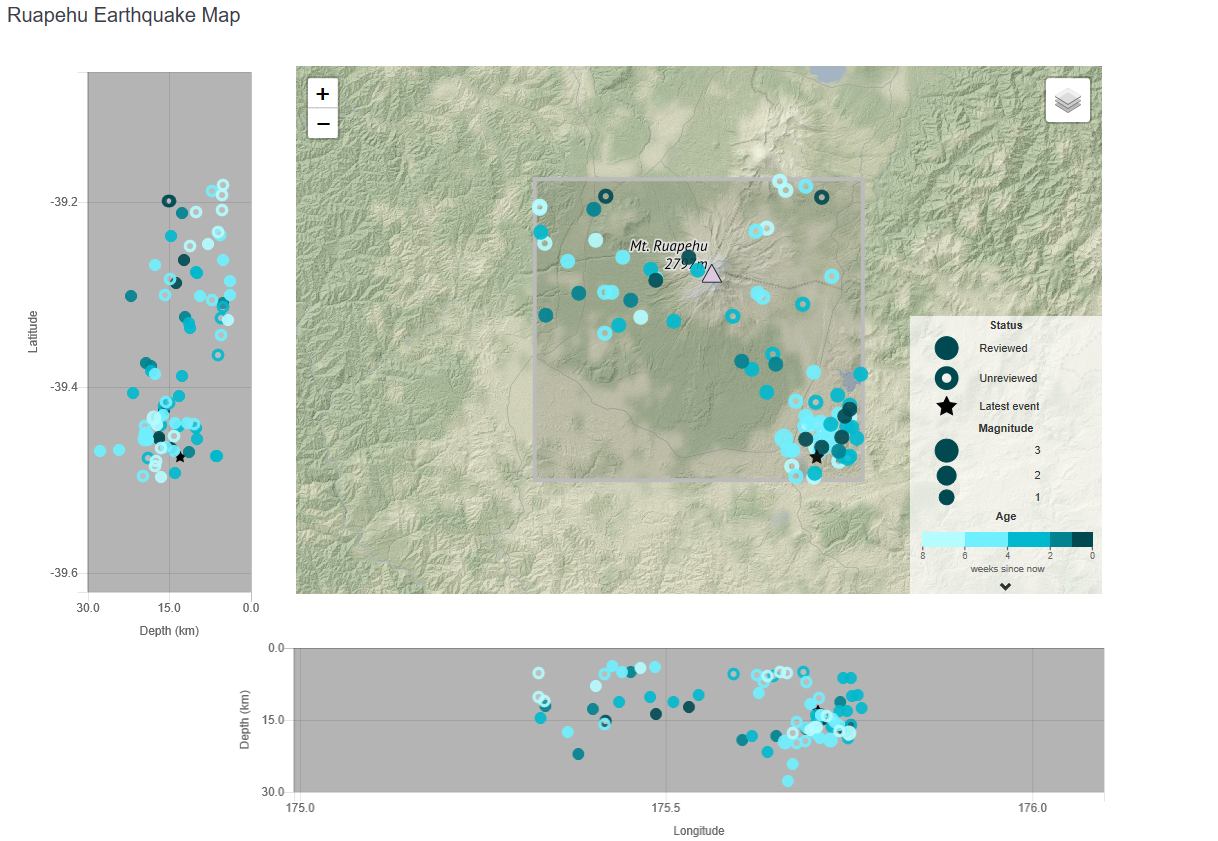
Enhanced earthquake epicentre location map for Ruapehu with cross-sections.
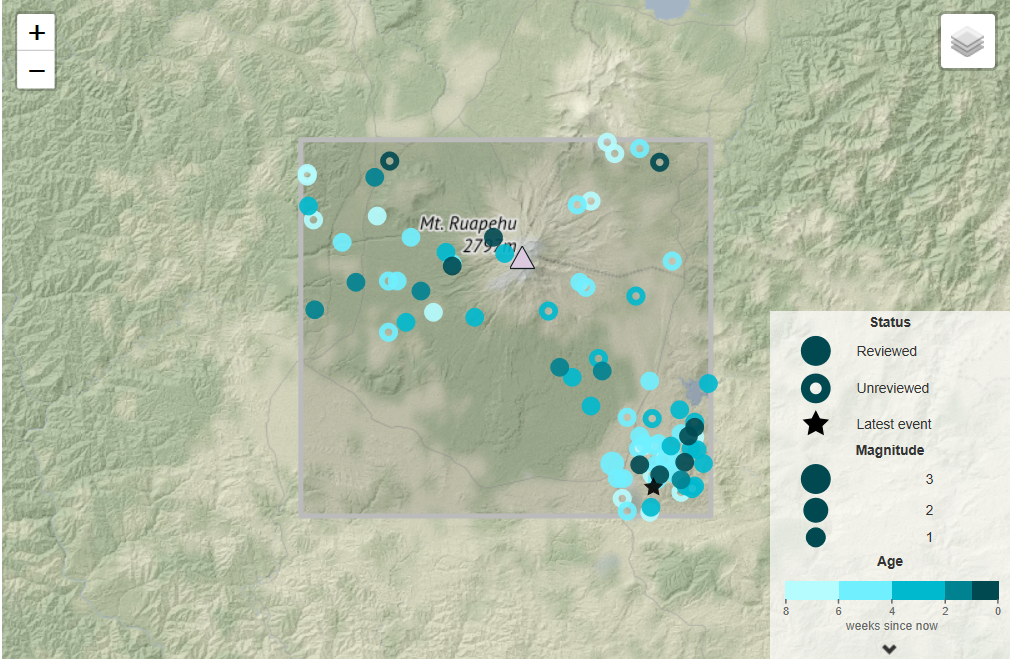
Standard earthquake epicentre location map for Ruapehu.
We also now have three time-series plots under the map showing the number of earthquakes per day, their depth and magnitude. The time series plots go back 8 weeks and use the same graphical colour scheme as the location map. Using these plots, you can follow any changes in depth or size of the earthquakes through time. The number per day is useful during earthquake swarms.
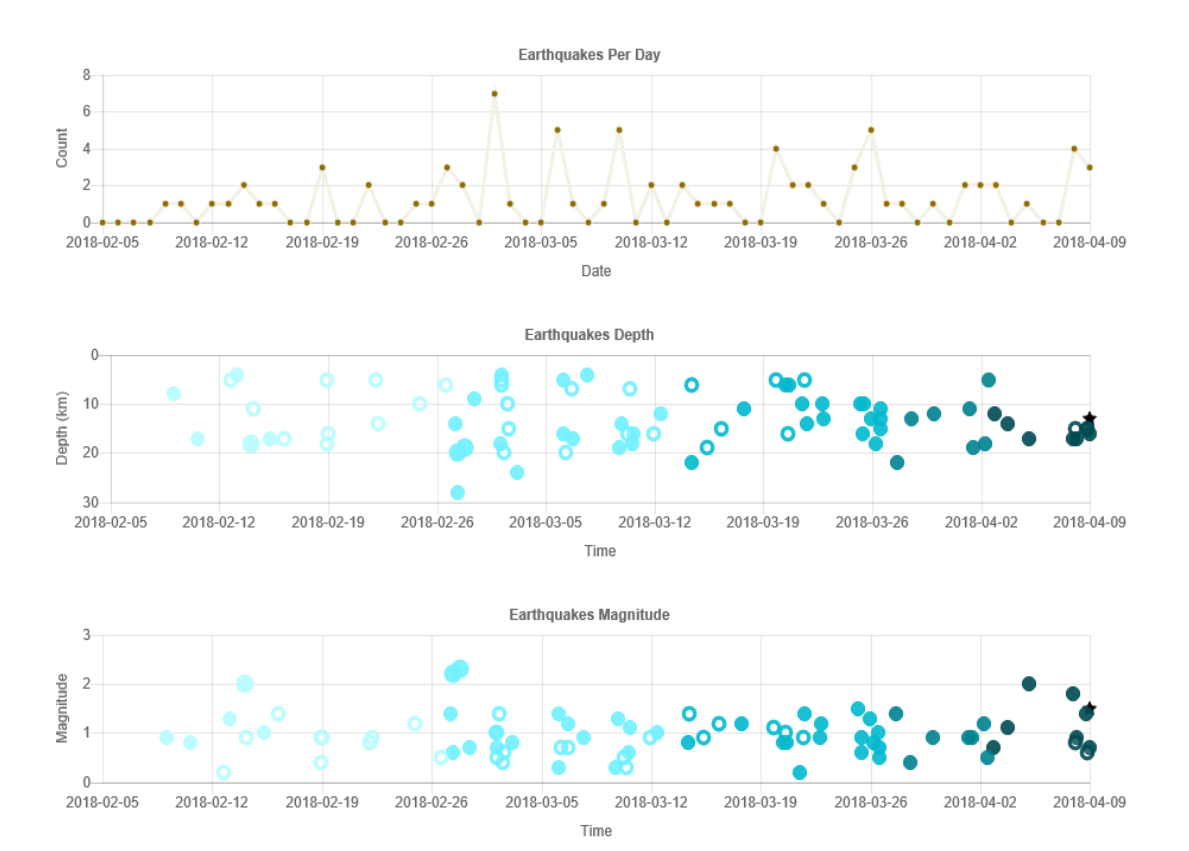
Time series plots for the last 8 weeks at Ruapehu showing number of earthquakes per day, their depth and magnitude.
When you explore the volcano tab on the GeoNet website you will discover links to lots of information about the status of volcanoes, the seismic drums, RSAM and SSAM plots and web cameras. A little deeper down, under each volcano , we have information about the volcano, the alert level, monitoring and earthquakes. The focus here today is on the earthquake tab and how we have revised the display of the earthquake data.
We hope you enjoy these revised pages as much as our volcano duty team. See if you can spot any trends!