2017 in review – and where is GeoNet heading in 2018?
We are thankful that 2017 was relatively uneventful. With no earth-bending earthquakes like the M7.8 Kaikoura earthquake we could focus on getting more of the fascinating science out to our followers and look at where GeoNet is heading in 2018.
One year on from the M7.8 Kaikoura earthquake we released a special issue of our GeoNet News magazine, which provided an overview of the science of the quake. Heaps of ground-breaking research has revealed more of the complex processes occurring beneath our feet here in Aotearoa!
It is sobering to think that the Kaikoura quake was the most complex earthquake ever recorded on modern instruments, like seismographs and strong motion sensors. The energy released caused more than 20 fault segments from south to north across the North Canterbury and Marlborough regions to rupture for more than 90 seconds. Our thoughts are often with the resilient people in these regions who are continuing to rebuild their lives.
While 2017 seemed quiet on the surface and most of us felt safe as houses here on terra firma, deeper down the earth was still on the move. The aftershock sequence from the Kaikoura mainshock extended into 2017, and a year on more than 19,000 aftershocks linked to the Kaikoura quake had been recorded by our network. You can read more about the complexities of the Kaikoura earthquake sequence here.
And casting the net wider, earthquakes continued to shake most parts of New Zealand at some stage. The image below shows the 28,600 earthquakes that our network recorded in 2017. This included over 400 earthquakes of M4.0-4.9, and 41 earthquakes of M5.0-5.9. The largest event recorded last year was a M5.6 earthquake 15km west of Kaikoura on 22 October.
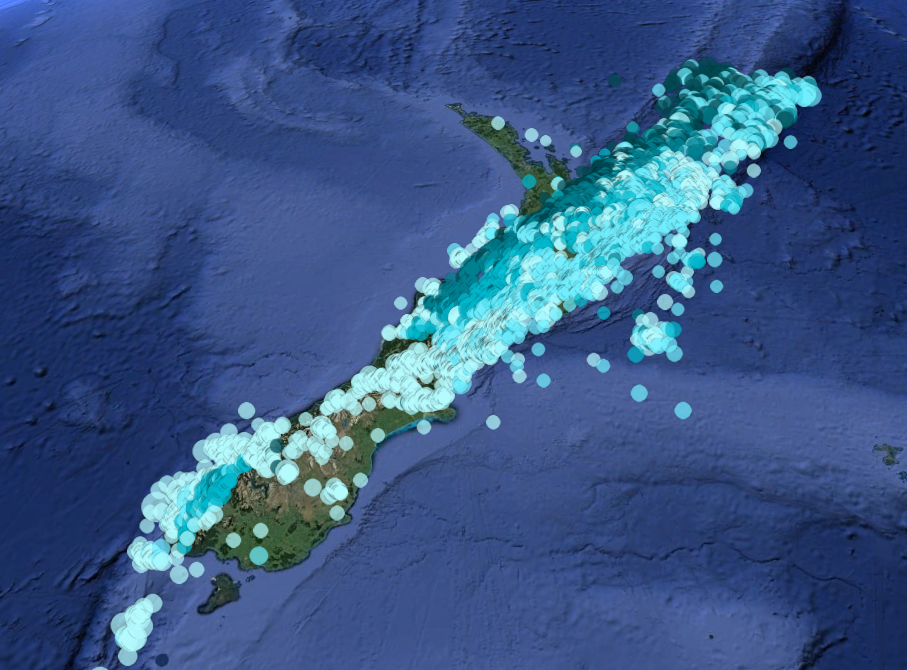
Across New Zealand, 28,600 earthquakes were recorded by our network in 2017.
Within these 28,600 quakes we looked more closely at some earthquakes to try to understand how they fit into the bigger tectonic picture of New Zealand, and we observed some interesting earthquake behaviour.
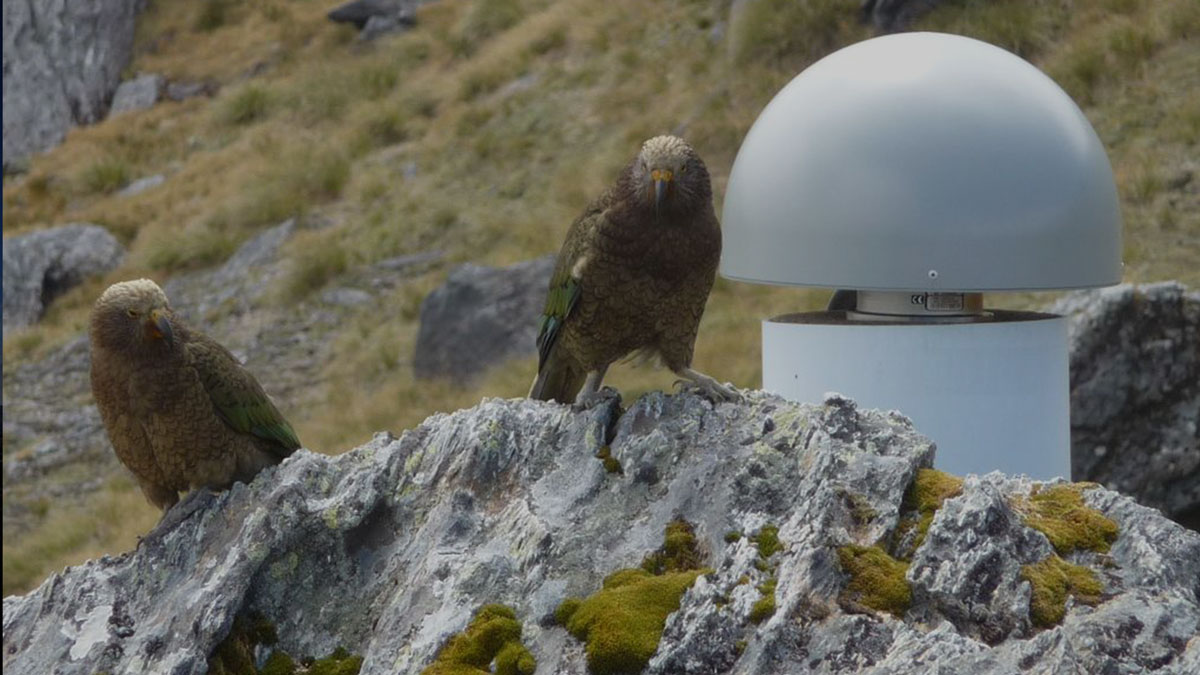
For example, we paid particularly close attention to a swarm of earthquakes that occurred near Turangi in March, shown below.
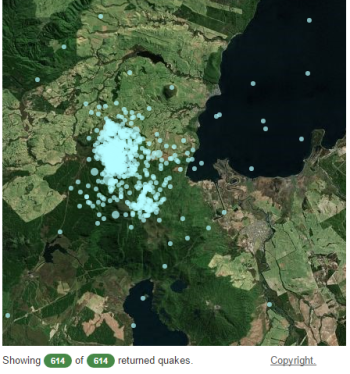
Turangi swarm March 31, 2017.
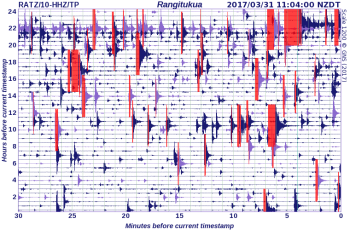
Rangitukua drum March 31, 2017.
The larger earthquakes in this swarm happened as clusters of quakes with similar magnitudes, compared to more common earthquake sequences, which have a 'mainshock' followed by many smaller aftershocks.
The Turangi swarm caused a spike in public interest because people thought that these earthquakes could be linked to volcanic activity. But as Dr Bill Fry, a seismologist here at GNS Science explained, “we used sophisticated processing to refine the first locations shown on GeoNet Rapid and determined very precise locations for these earthquakes. This quickly ruled out an obvious volcanic source of the earthquakes, as they happened in the upper crust, away from the volcanoes”. You can read more about the Turangi swarm here.
We also spent a lot of 2017 analysing earthquakes that were triggered by the M7.8 Kaikoura earthquake. Surprisingly, we discovered that the strong shaking that many New Zealanders felt on that night also created a measurable response in the earth as far away as Fiordland and Northland.
In fact, these areas, inluding the Coromandel, Great Barrier Island, and the Taupo Volcanic Zone, appear to have generated their own seismic energy when the ground shaking passed through.
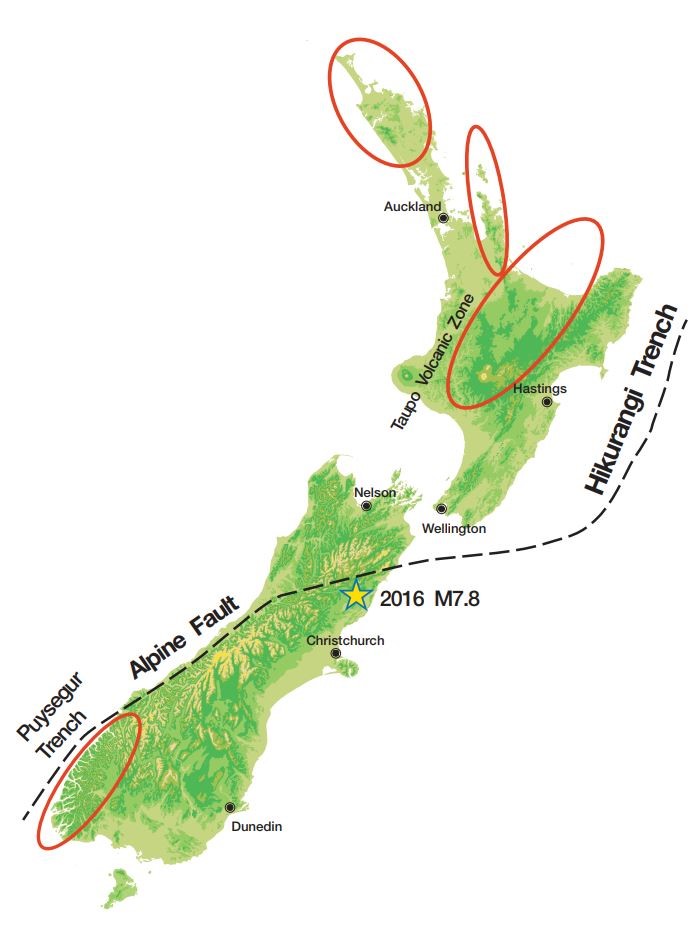
Focused areas of increased seismicity following on from M7.8 Kaikoura quake.
Our seismometers in these areas recorded a rumbling vibration that we call ‘tremor’, and our scientists are still working hard to understand if this tremor is coming from faults or from interaction between the Kaikoura earthquake waves and underground water and/or magma!
Interestingly, some of these areas, such as Northland and Coromandel, have a relatively low earthquake risk. This just goes to show that while some areas of New Zealand have more earthquakes than others, the whole country is active.
Earthquakes further afield
The second half of 2017 highlighted how vulnerable New Zealand is to tsunamis triggered by earthquakes a long way from our shores!
The M8.2 earthquake in Mexico occurred around 5:30pm (NZST) on Friday 8 September, as many kiwis were making their way home from work. Unbeknown to most, because no one had felt the tremor (the epicentre of which was situated in the Gulf of Tehuantepec off the southern coast of Mexico), Ministry of Civil Defence and Emergency Management (MCDEM) and GeoNet duty teams were on high alert.
As soon as our 24/7 pager system notified us, GeoNet and MCDEM duty officers worked rapidly to assess the changing information to understand the risk to New Zealand and the timeframe for arrival here. You can read more about how our experts work under pressure to predict how tsunamis coming from across the Pacific Ocean may affect us here and here - it is a tricky task because the information changes fast.
A beach and marine tsunami warning was issued across some coastal areas of New Zealand, including the Chatham Islands, Banks Peninsula, Pegasus Bay, and the Northern Coasts of Hawke's Bay and East Cape. A beach and marine warning means that we don’t think the tsunami is big enough to inundate land, but it may cause strong and unpredictable currents and surges in the water or on beaches and river mouths, so it’s best to stay out of those areas. It took about 12 hours for the waves to arrive on New Zealand shores, and the highest wave amplitude of 35-40cm was recorded on GeoNet’s tsunami gauge at the Chatham Islands.
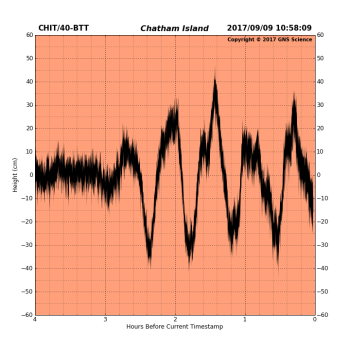
Plot of the peaks and troughs in the tsunami waves as they arrived at the Chatham Island tsunami gauge.
Close to home, we keep our nearshore tsunami gauges well maintained so they can monitor sea levels and pressures constantly and alert us when something unusual occurs. On 22 December 2017, a magnitude 5.9 earthquake occurred on the southern margin of Curtis Island in the Kermadecs, ~200km south of Raoul Island, and within a couple of hours our gauges at Raoul Island had detected a small tsunami. This was a curious situation because we would not expect to see tsunami waves caused by an earthquake of this magnitude, and it has presented a little mystery for our tsunami scientists to solve. You can find out more about this here.
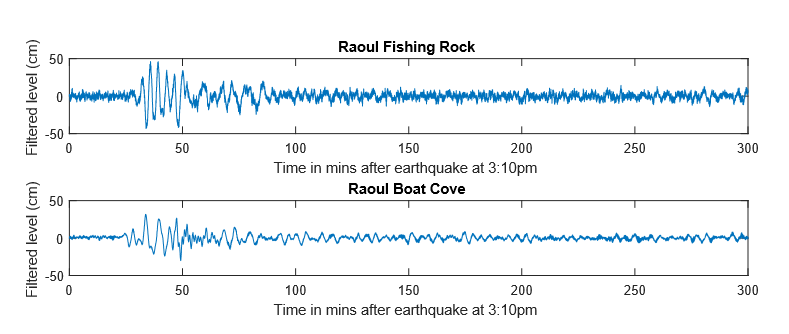
Raoul pressure gauges showing tsunami arrival time (in minutes after 3.10pm) and height (cm).
In the Mexico situation, there was around 12 hours of warning time for New Zealand. While our experts did an impressive job of estimating arrival timeframes in this situation, the unpredictability and rapid arrival of a tsunami generated close to our shore means that time is much more limited and you need to evacuate without an official warning. Remember, if you are on or near the coast and you feel an earthquake that is long (more than a minute) or strong (it’s hard to stand up), get gone. You can find the areas you need to evacuate on the MCDEM website, along with other useful information for being prepared.
Improvements to our website, including our new network map!
Our new website went live in June, as our old website had become reliant on older technology and wasn’t meeting the standards required for GeoNet and the people and organisations who rely on our information. These major website renovations have been swiftly followed by developing and adding new features throughout the second half of 2017, which have focused on improving the accessibility and display of GeoNet data.
GeoNet’s snazzy, new and improved network map came into action in November 2017 so you can now see where all our network sites, including seismometers, continuous GPS stations and tsunami gauges (pressure sensors), are located on an interactive map. You can find the map on the Network Map page under the Data drop-down tab on the GeoNet homepage.
By scrolling in and out of the map, and panning around, you can locate all the network sites and the monitoring equipment collecting different data at each site.
The menu in the top right corner of the map provides a symbol menu so that you can select the network sites you want to find. For example, by scrolling in on the Chatham Islands and selecting barometer, hydrophone and pressure sensor, you can rapidly locate where the Chatham Island tsunami gauge is located, at Owenga on the southeast coast.
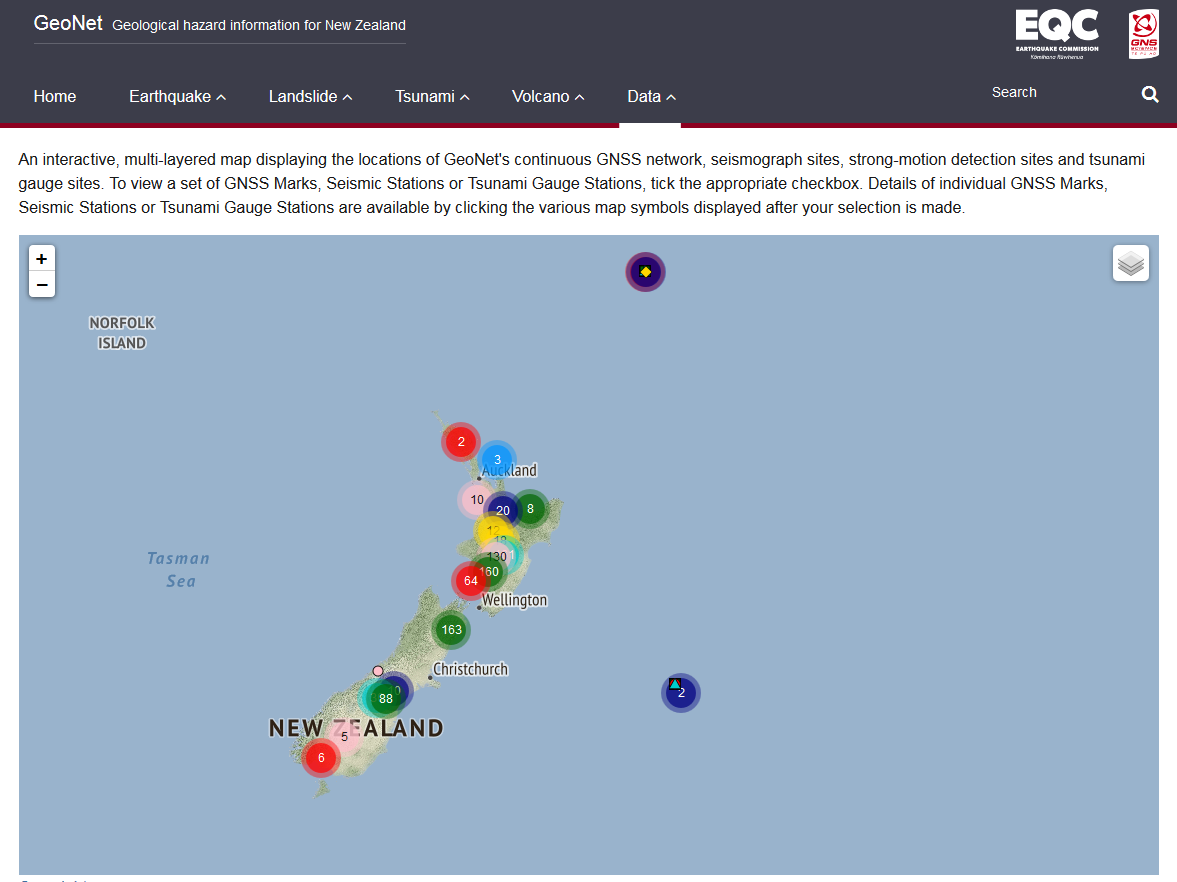
Overview of new and much improved, interactive network map.
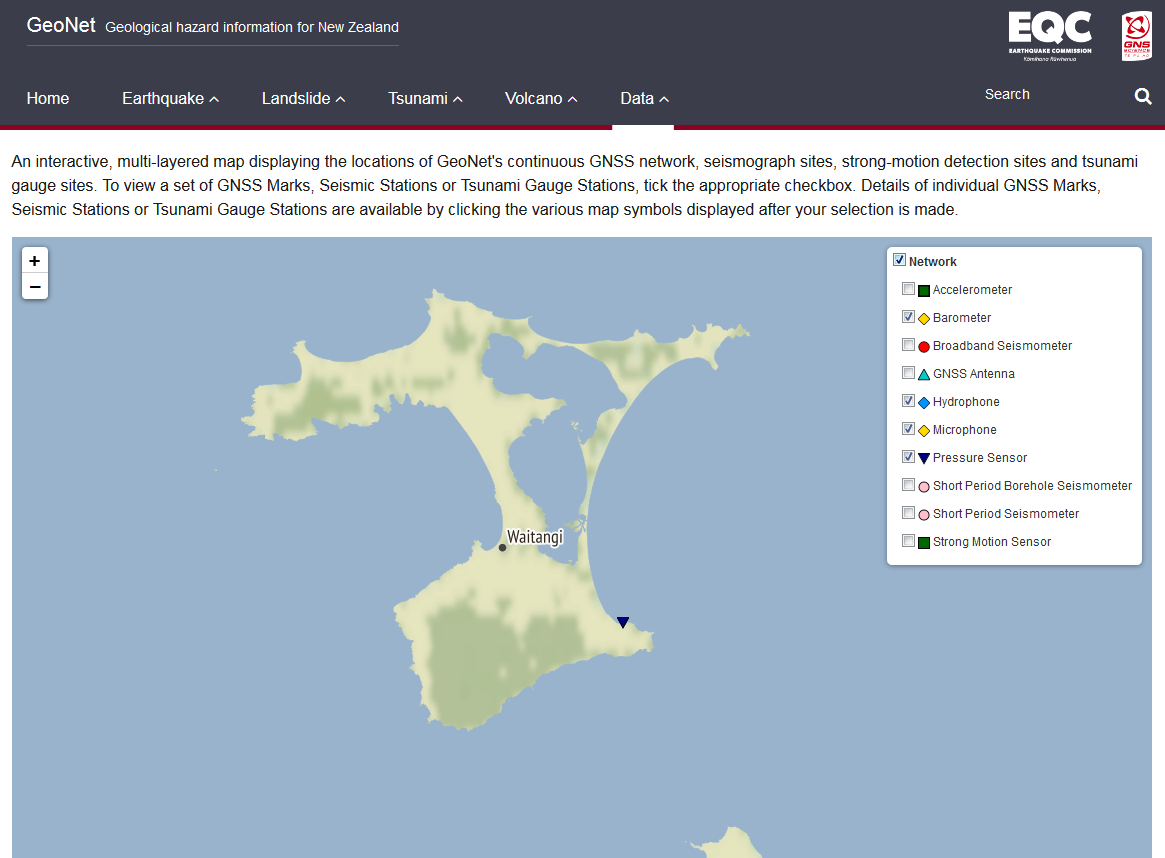
Location of Chatham Island tide gauge.
One of my other favourite new data features (as very much the ‘data novice’) is our strong motion map, which displays peak ground motion measured at our strong motion sites in the last hour. However, you should follow your nose around the site and see what is available and what you like. As always, we’d welcome your feedback here!
Along with GeoNet’s updates and renovations, MCDEM and GNS Science have been working hard to develop some important tools. For example, in November 2017, the national cell broadcast warning system went live. MCDEM deserves a shout out, because although there were a few teething problems, cell broadcasts will vastly improve our nation’s readiness for tsunamis, and tools such as these will be improved and integrated into GeoNet’s operations over the next couple of years.
So where is momentum heading with GeoNet in 2018?
Fast forward into 2018 (crikey, it’s February already!) and things have certainly kicked into action for the year here at GeoNet. Just like New Zealand’s hazard space, GeoNet is on the move this year, and it’s important to keep all of you in the loop.
We get a lot of earthquakes here in New Zealand. This, as well as the proximity of Auckland and other centres to volcanic hotspots, the issues caused by landslides throughout New Zealand, and the need for better warning systems to assist New Zealanders to adapt and prepare for distant and local tsunami, are front-and-centre of GeoNet’s ongoing development.
This is why GeoNet is currently working towards Enhanced Geohazard Monitoring (or what is fondly known as EGM) over the next three years. EGM has become some of the GeoNet team’s bread and butter since a business case was accepted by the Ministry of Business Innovation and Employment in late August 2017.
GeoNet was originally designed to collect data and to support geohazard risk management, rather than for emergency response. But GeoNet has become a key information source for many people and the science we provide feeds into MCDEM emergency response processes and official warning systems.
EGM aims to improve how quickly and accurately we can detect and evaluate geohazard threats to New Zealand, so that we can respond better to potential emergencies and get information out faster. In 2018 our focus is on getting the foundations in place for 24 hour, 7 days a week monitoring of our geohazards.
Of course, our network of sensors monitor New Zealand’s movement all the time, but we currently don’t have actual people awake 24/7 to interpret the data that comes in from these and overseas sites. Duty officers are currently paged outside of normal working hours if an event occurs, and can respond at short notice to evaluate the situation from home, or wherever they may be. But with EGM our scientists will provide round-the-clock monitoring so that we can provide information even faster.
EGM will involve a lot of work for our team this year, but GeoNet will be an even more slick, well-oiled machine better providing what New Zealand’s emergency managers, data users and communities need! We will be keeping you posted as EGM begins to be put in place.