Utiku Landslide
Information recorded from the landslide is being used to calculate the landslide velocity, identify areas of movement and assess the movement patterns of the landslide to aid KiwiRail to plan potential mitigation strategies.
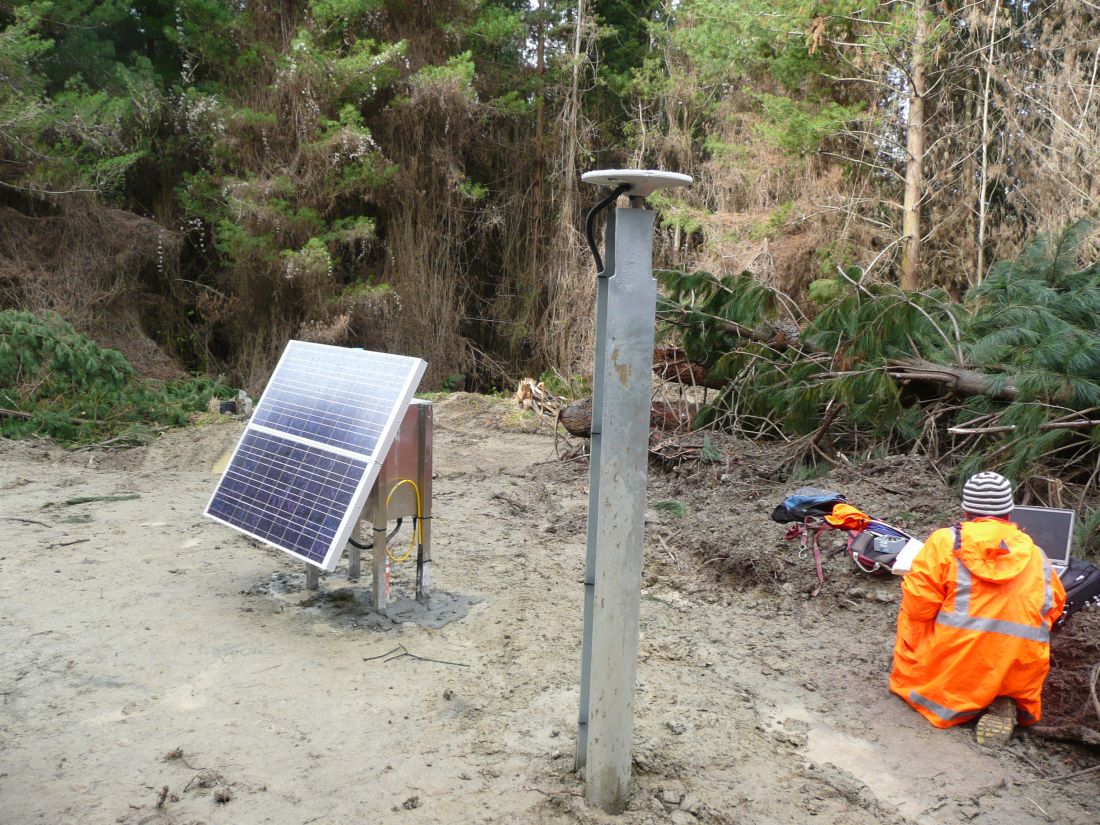
Monitoring of landslide movement using continuous GPS.
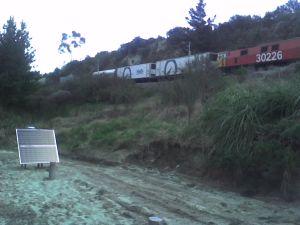
View of the North Island Main Trunk railway and monitoring equipment.
The Utiku landslide has been classified as a deep-seated translational block-slide earth-flow. This classification refers to the characteristics of the landslide. Deep-seated refers to the depth of movement (depth to the landslide slip-plane); the slip plane of the Utiku landslide has been recorded at 20m below ground level at the toe (bottom) and increasing to 65m towards the back scarp (top). The term translational refers to the movement style of the landslide, where it moves as a relatively intact mass (raft) of material, along a planar zone of weakness. In this case, the zone of weakness corresponds to a thin clay layer thought to represent a bedding plane within the local sandstone. The term block-slide and earth-flow describe the landslide structure and movement mechanisms.
Historical information from ground surveys (dating back to 1964) indicate that landslide movement is triggered by rainfall, and to a lesser extent erosion caused by the Hautapu River, located along the toe of the landslide. Periods of prolonged rainfall cause groundwater levels to rise, which lead to a reduction in strength of the materials forming the landslide slip plane (clay layer). It is this reduction in strength that leads to movement of the landslide. Movement of the landslide can therefore be linked to rainfall events. As more data is collected it will be possible to determine movement triggering thresholds, e.g. how much rainfall does it take to trigger movement and by how much does the landslide move. In the past it has been impossible to correlate the triggering factors to the different periods of landslide movement due to the large time intervals (typically greater than yearly) between the historical surveys. To overcome these problems GNS Science installed new monitoring equipment on the landslide in June/July 2008.
Monitoring Equipment
The equipment installed on the landslide is designed to monitor two triggering factors and two response factors:
- Rainfall (trigger);
- Ground shaking intensity (trigger);
- Groundwater levels (response);
- Surface movement (response).
Rainfall is being monitored by two rain gauges. One rain gauge is installed in the central landslide, the other near the landslide head scarp and so the variation in rainfall across the landslide can be monitored. These rain gauges record rainfall as and when it occurs, therefore allowing the precise time of peak rainfall to be determined. Equipment to record ground motion in response to earthquakes is installed on the landslide. Groundwater levels within the landslide are being monitored using piezometers installed in 4 boreholes. The piezometers are recording groundwater levels acting along the slip plane of the landslide.
The surface movement of the landslide is being monitored using continuous GPS and the collected data is managed and displayed through custom software, which allows the entire system to run remotely. The monitoring equipment installed on the landslide has been strategically located based on engineering geological mapping and the results from historical surface movement surveys. A GPS station has also been installed off the landslide (on stable ground) to act as a reference for the monitoring.
The Monitoring Network
At present the GPS network installed on the landslide is being used to calculate daily solutions (i.e. a position every 24 hours), the piezometers record a groundwater measurement every five minutes and the rain gauges record rainfall as and when rainfall occurs. The data from the instruments on the landslide is transferred to GNS Science via a communications network. The data is then checked and the results are calculated. The process of retrieving the data takes approximately one hour from site (Utiku) to the office (GNS Science, Avalon).
Results from the Monitoring
Recent monitoring data can be viewed here (Graphs A, B & C).
To view the data for the different GPS stations, piezometers and rain gauges please select the item from the left hand side of this window and select refresh or reload on your browser. The different instruments can also be selected from the map, and the data for the chosen instruments will be shown once the refresh button has been clicked. The results shown on this web page are updated every 15 minutes.
The data shown on Graph A is the horizontal movement (displacement) calculated for each GPS station. The main direction of historical landslide movement is approximately 140 to 160 degrees (towards the south-east) and the displacement of each prism has been calculated based on these historical movement bearings. The data plotted on Graph A represents the average movement (of each prism) over a 24 hour period (daily average), with the data plotted cumulatively to give an indication of the total movement since monitoring began. The spikes in the data (shown on Graph A) are a result of errors. These are typically in the range of 1 to 3 mm. It is therefore important when assessing movement of the landslide to look at the trends in the data rather than individual measurements. The data shown on Graph B is from the piezometers and has been shown as a water level relative to the ground surface in each of the 4 locations, and the data in Graph C shows the daily rainfall.
The information contained on this website is designed to give the viewer an overview of the monitoring being carried out by GNS Science. Much more detailed information is actually being gathered for the landslide, and this information is being used to assess the movement patterns and movement triggering thresholds of the landslide.