Tsunami Monitoring Gauge Data
Tsunami gauge data records sea level variations using a pressure sensor. This is our collection of tsunami-related data resources and tools.
The tsunami gauge data is collected by two pressure sensors (labelled streams/locations 40 and 41) at each station. This provides a backup in case of failure of one of them. The tsunami gauge stations may be viewed on the network maps, and the site locations and operational dates may be found in DELTA.
New Zealand's tsunami gauge data that are maintained by GeoNet are shared in real time with overseas data centres and their warning systems.
De-tiding the tsunami gauge data
The tidal portion of the observed sea levels can be removed by using predicted tidal heights. The tides at a given site can be modelled using the "Harmonic Analysis" method if a sufficiently long sea level record is available. Mathematical techniques such as Fourier spectral analysis or least squares fitting are applied to the recorded tidal heights to deduce their various tidal components. These components, or "constituent tides", are represented as an amplitude and a phase. These constituents have been given codes, such as "M2" & "S2" which are the two main Lunar and Solar components of the tide. The height of the tide for any given time can be calculated by summing the constituent components calculated for that time. This height can be subtracted from the observed sea level to produce the "detided" data stream.
Data Access
Waveforms
Tsunami Gauge waveform data can be accessed in the same way as seismic and acoustic data through the following methods:
- FDSN webservices - recommended
- SeedLink
CREX
CREX is the name of a character code for the representation and exchange of meteorological and other data.
Tsunami gauge data are stored as day files in CREX format and are available via anonymous data from:
- data.geonet.org.nz/coastal
- AWS Open Data (recommended for bulk and routine downloads)
CREX is the name of a character code for the representation and exchange of meteorological and other data, and is defined by the World Meteorological Organization, an agency of the United Nations.
Each day file is accompanied by a qc ("quality control") file. This shows the number of samples expected in the file and the number of samples actually present. Ideally, a file is 100% complete; however, equipment malfunction or loss of communications links can cause data completeness to fall short of this.
Derivation of CREX one minute values
The dataloggers sample the pressure sensors at both one and ten samples per second. The one minute sampled data stream is built at the data centre by decimating the one second stream. To avoid aliasing of higher frequencies, a filter needs to be applied to the incoming data. However, the requirement that this filter be low latency means that the more standard FIR filters, as used in the dataloggers themselves, of any reasonable length cannot be used (the latency goes up as the number of coefficients in the FIR filter increases). One option is to simply average the samples for each minute, this is essentially applying a boxcar filter which, without the presence of a mechanical stilling well, has some undesirable spectral characteristics related to the sharp edges of the window. An alternative is to apply the much better behaved Gaussian Filter, which can be implemented along the lines of a 1D Gaussian Blur, as used in image processing. The Gaussian filter is designed to have its -3 dB roll-off at the Nyquest frequency (i.e. 1 / 120 samples per second) and suppresses any higher frequencies. The filter is well behaved and has a delay of 45 seconds, as it examines 45 samples before, and after, each sampled minute.
Tsunami Gauge Images
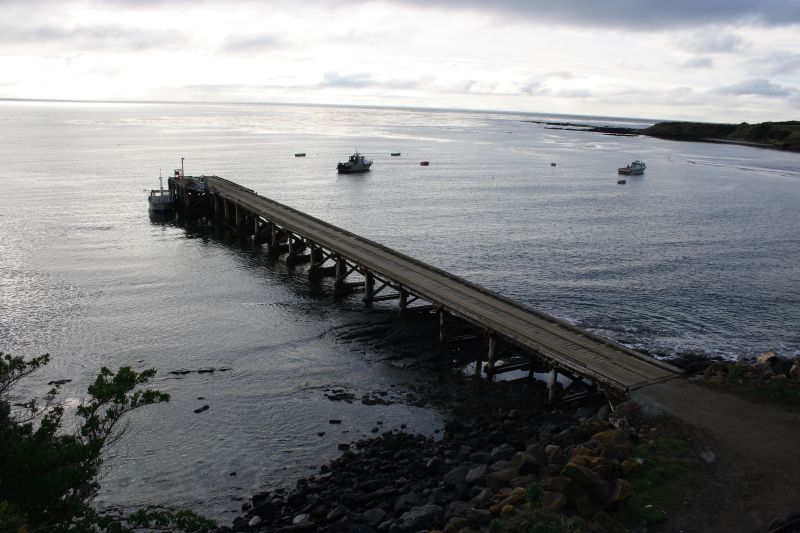
Owenga Wharf Tsunami Gauge
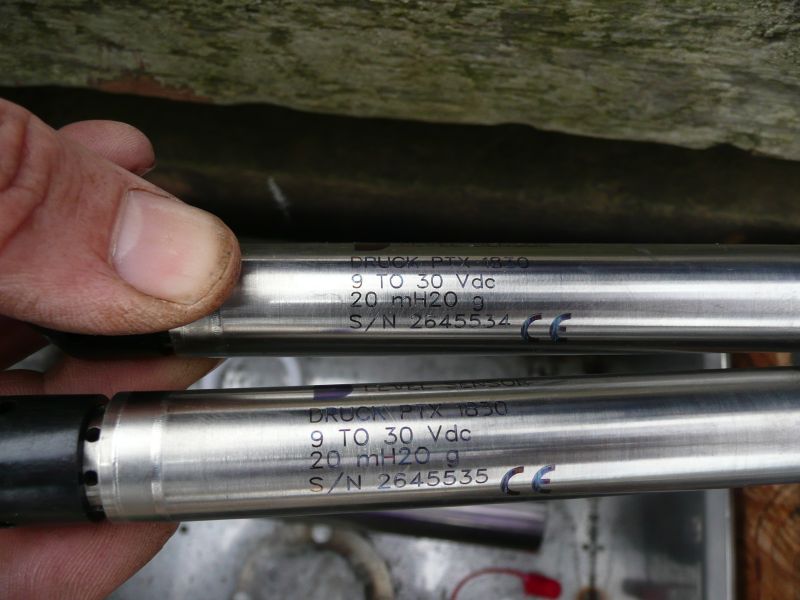
Pressure Sensors