How we monitor volcanoes
Monitoring active volcanoes requires the use of several techniques collectively known as Volcanic Surveillance. Multiple areas of science are used in studying the behaviour of an active volcano. Data from all disciplines are collected, analysed and cross-referenced, to help give an understanding of behaviour at the volcanoes and an insight to future eruptions.
Visual and Cameras
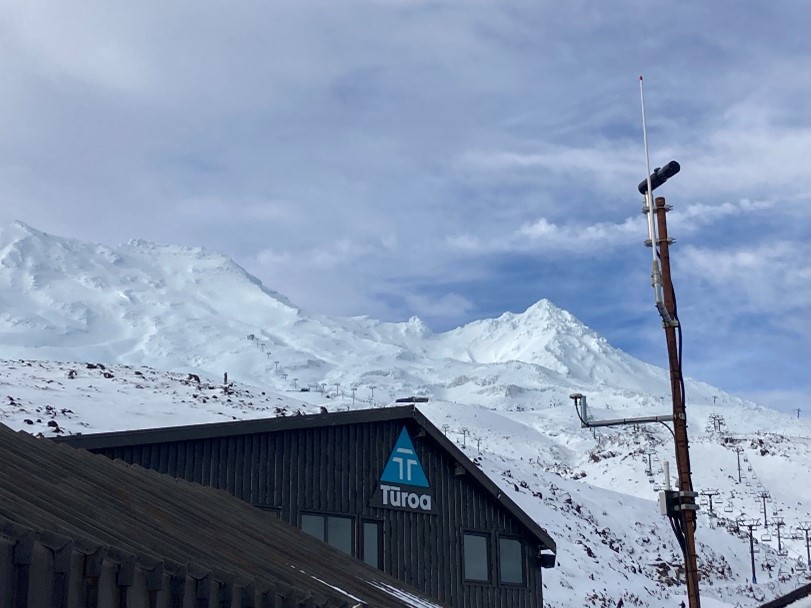
It is not possible for a scientist to visit a volcano every day, so we now use remotely operated cameras to supplement those observations. The cameras we use are specifically designed for remote operation. They are setup to take an image very second and then transmit an image every 10 minutes to our data centres and website.
Several of the cameras are some distance from the volcano, some are based at locations where we have power and communications. However, some of the cameras in remote locations such as Tongariro National Park are solar powered. The images are then transferred to our data centres and onto the website across internet data links. Our cameras have both daylight and low light cameras installed, allowing pictures to be taken at night when there is enough ambient light such as from a full moon. If we wish to see images during unrest or an eruption, we can download the high data rate images as needed. For more detail see Volcano Cameras.
Chemistry
As the molten material (magma) rises in the volcano to shallower levels, heat and gases are released as they rise to the surface.
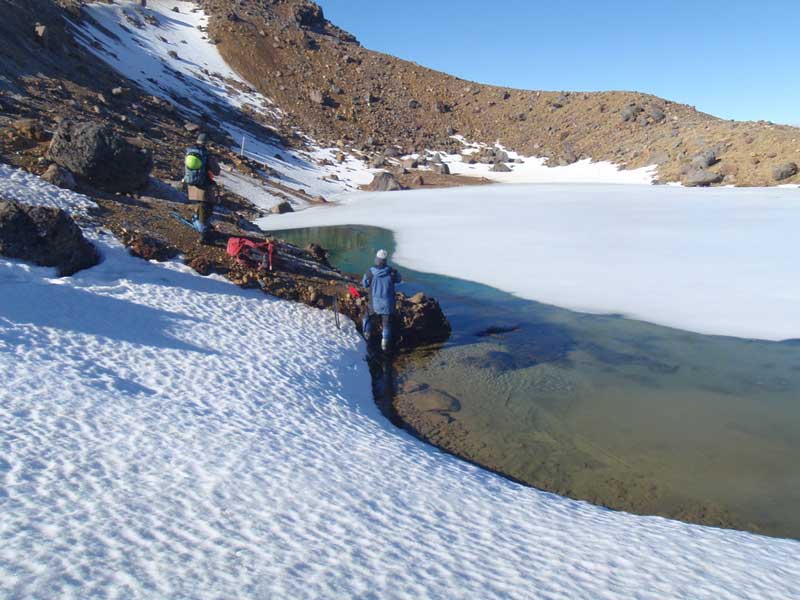
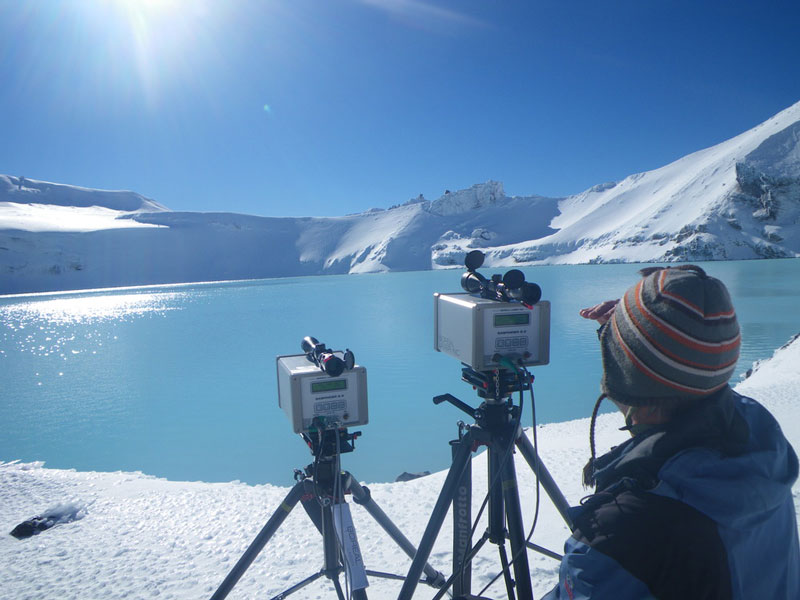
Chemistry measurements and sampling of Mount Tongariro
Sampling at warm ground on Tongariro eastern slopes below Lower Emerald Lake
Usually gases are discharged through gas vents (fumaroles) and we can measure the temperature and composition of these gases by taking regular samples. As magma rises in the volcano, the temperature of fumaroles may increase, and their chemistry will change. Sometimes the gases emerge under a lake, or interact with groundwater in the volcanic edifice. Also the heat from the rising molten material can heat the ground water to form hot springs and lakes.
Changes in the water chemistry of crater lakes and thermal spring waters are used to detect changes in the behaviour of the volcanoes and their associated geothermal systems. Geochemical surveys include sampling of selected springs, lakes and streams at places like Tarawera (hot water beach); Red Crater and Central Crater on Tongariro; Ruapehu Crater Lake and the crater lakes like those at Waimangu.
Monitoring specific water parameters such as temperature, pH, conductivity, and concentrations of dissolved gases can provide insight into the processes expected to accompany unrest or renewed volcanic activity. Changes in groundwater, lake levels, rates of stream flow can also give evidence of unrest within a volcano. Crater lakes are valuable indicators of the status of volcanic systems. For example, at Ruapehu we often see the magnesium concentrations increase if new/fresh rock is made available to the crater lake waters.
Gas
When molten material (magma) moves into a volcano it gives off volcanic gas emissions which are measured regularly at our volcanoes. There are several techniques which include measurement done from an aircraft and on the ground. The four primary techniques, two airborne and two ground-based are outlined below.
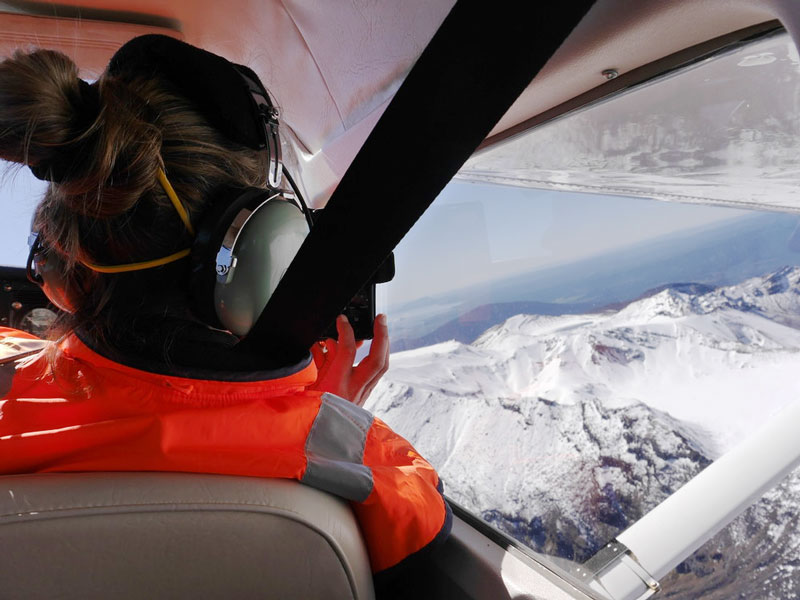
Watch Karen Britten fly over active volcanoes in New Zealand to measure the amount of volcanic gases being released into the atmosphere in tonnes per day.
Airborne Gas Monitoring
COSPEC/FLYSPEC
A Correlation Spectrometer (COSPEC) or a FLYSPEC measure the absorption of ultraviolet light by SO2, so the SO2 content of the volcanic gases is determined by flying under the gas plume (at right angles to the wind direction) and looking up through it. The FLYSPEC is a miniaturized, lightweight correlation spectrometer more adaptable to different platforms than the COSPEC.
Ngauruhoe monthly gas flux flight.
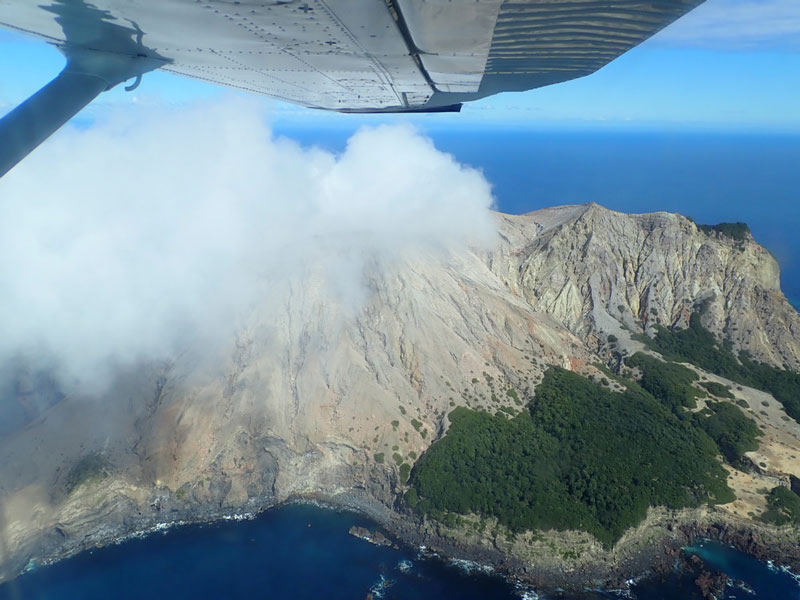
White island gas flux flight.
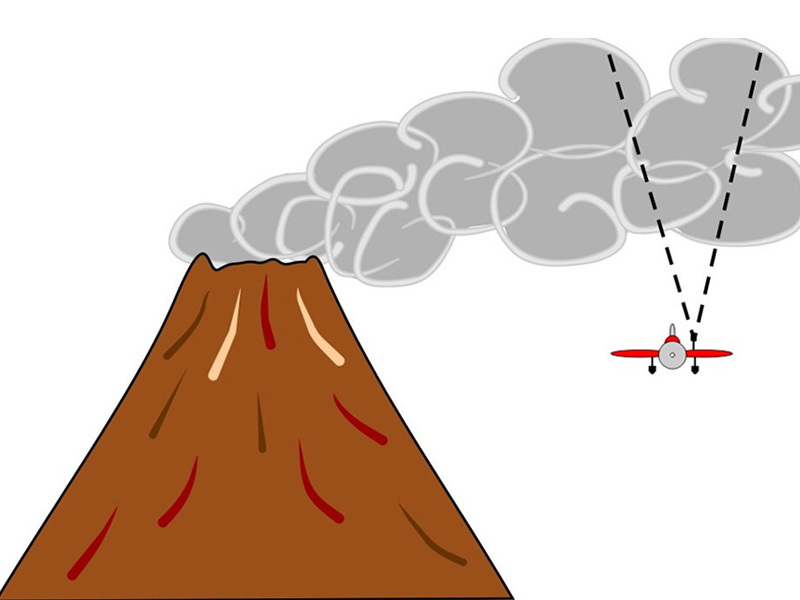
Diagram showing how COSPEC looks up at the plume.
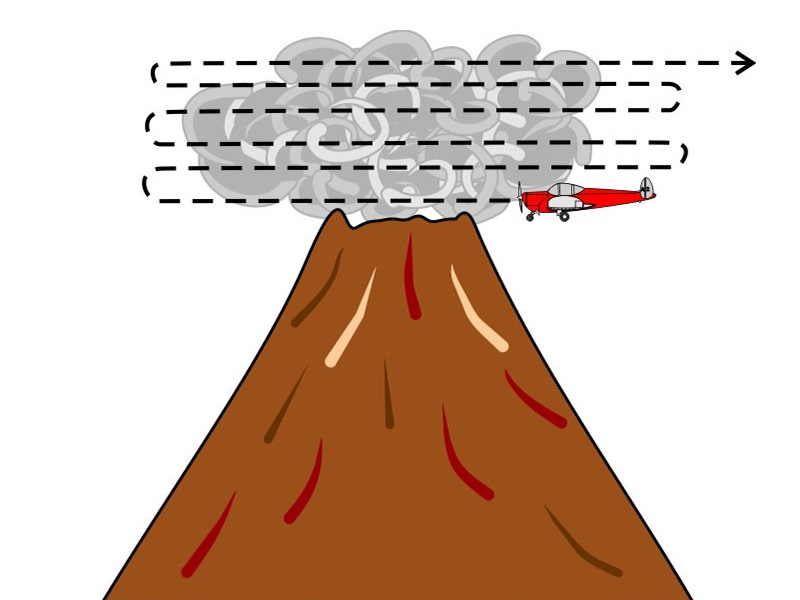
Diagram showing how the aircraft tracks through the gas plume for LICOR measurements.
Plume Contouring
The aircraft flies through the volcanic gas plume at different altitudes. A pump inside the aircraft sucks in the gases and the LICOR and Interscan instruments measure the concentration of carbon dioxide (CO2), sulphur dioxide (SO2) and hydrogen sulphide (H2S).
Ground Deformation
One of the key techniques used in volcano surveillance is monitoring ground deformation.
Laser Diode at Ruapehu Crater Lake.
Ground deformation is the change in shape that can occur prior to, during or after an eruption. Such ground movement can occur in response to the influx or withdrawal of molten material (magma) and hydrothermal or magmatic fluids in the volcano. Increases in ground deformation may signal the start of a new eruptive episode. There are numerous ways to measure such deformation, like levelling, triangulation and more recently using continuous Global Positioning System (cGPS) measurements and INSAR. It is also possible to use lakes as large tiltmeters.
Geodetic Levelling
Geodetic levelling is used to measure elevation differences between benchmarks and, by repeating surveys, elevation changes (vertical displacements) with time can be recorded.
Triangulation and Distance Measurements
A theodolite and EDM (electronic distance measurements) can be used to measure the change in shape of an area by making repeat measurements. This type of surveying has been replaced by GPS (see below).
Lake Levelling
A lake can be used as a large natural tiltmeter by measuring changes in the water-surface elevation relative to nearby stable benchmarks. A lake located within an area of active deformation presents a unique monitoring opportunity. Lakes are often present about volcanoes. In New Zealand we use Lake Taupō for this.
Continuous Global Positioning System (cGPS)
In order to make accurate cGPS measurements a stable monument must first be constructed that is well anchored to the bedrock at a depth of 5 - 10m. Attached to the monument is a geodetic-grade antenna and GPS receiver combination. These instruments are capable of metre accuracy in standalone mode. However, when the data are processed with those of nearby stations, accuracy of a few millimetres can be achieved. The necessity for an extremely stable monument then becomes obvious.
Most of our volcano cGPS stations record their position every 30 seconds which is averaged to produce hourly and daily positions. Some stations transmit their location once a second which allows them to be used as base stations by surveyors for cadastral surveying. In this mode millimetre accuracy coordinates are available on a continuous real-time basis.
INSAR
InSAR (Interferometric Synthetic Aperture Radar) is a technique for mapping ground deformation using radar images collected from orbiting satellites. Two radar images of the same area that were collected at different times from similar vantage points in space can be compared against each other. Any movement of the ground surface toward or away from the satellite can be detected to show how much the surface moved (deformed) during the time between images
Ground Based Gas Monitoring
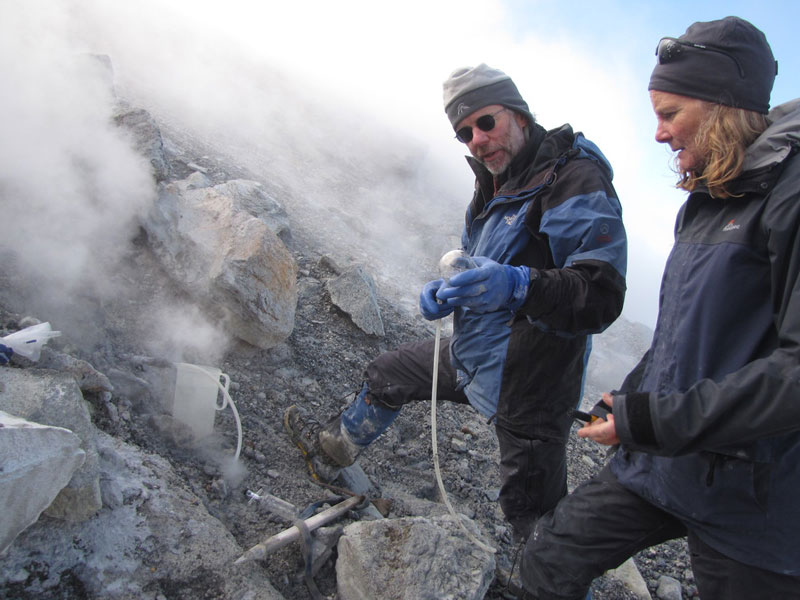
Soil Gas Flux Measurements
Gas emitted by volcanic systems can also seep up through the soil in the area surrounding a volcano. These soil gas emissions are measured with a soil gas flux meter. A round metal accumulation chamber is placed on the ground and the gas emitted from the soil is measured in the back-pack analyser. The soil gases we measure are carbon dioxide (CO2) and hydrogen sulphide (H2S).
Measurements of soil gas flux have been used at Raoul Island, Ngauruhoe and Tongariro to track changes in the volcanoes and look for signs of volcanic unrest. Regular measurements were used at Whakaari/White Island until the 2019 eruption prevented access.
Soil gas flux measurements are also used in geothermal areas such as Rotorua to map the geothermal area and determine the risks to public health posed by gases.
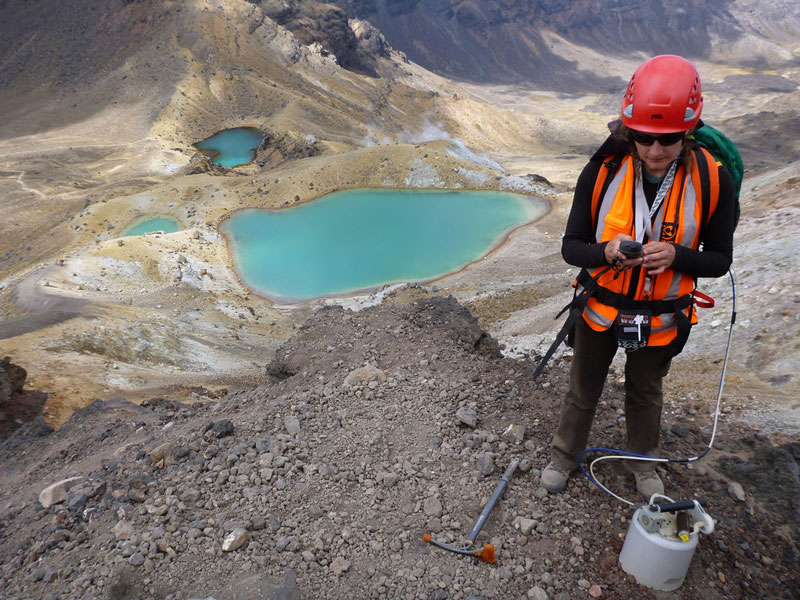
Soil Gas Flux Measurements Red Crater.
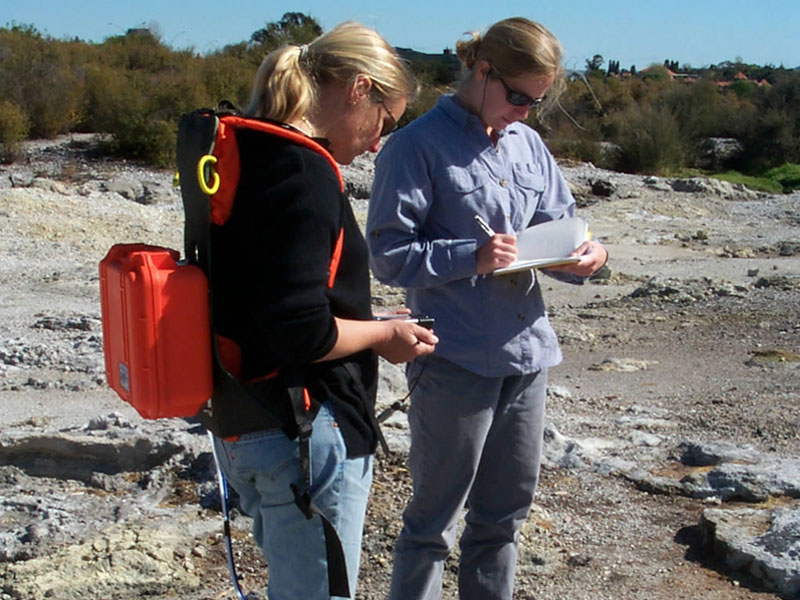
Making soil gas measurements.
ScanDOAS
A network of continuous gas emission detectors, tuned to detect SO₂ (sulphur dioxide) gas around Ruapehu volcano, allow us to monitor the amount of SO₂ the volcano produces. The sensor technology is based on differential optical absorption spectrometry (DOAS). The ScanDOAS sensors measure the absorption of the ultraviolet light from the sun by monitoring the SO₂ gas present in the volcanic plume produced at a volcano.
We also have two DOAS systems at Te Maari.
DOAS systems at Te Maari
Crater Lakes
When volcanic craters cool down after major eruptions, they often fill with water to form crater lakes. Some are cool, just filled by rainwater, while others are warm or hot and remain connected to the volcanic plumbing. The colour of crater lakes varies markedly according to the temperature and chemistry of the water, and the type and concentration of particles suspended within it.
Ruapehu Crater Lake.
Whakaari/White Island Crater Lake in 2016.
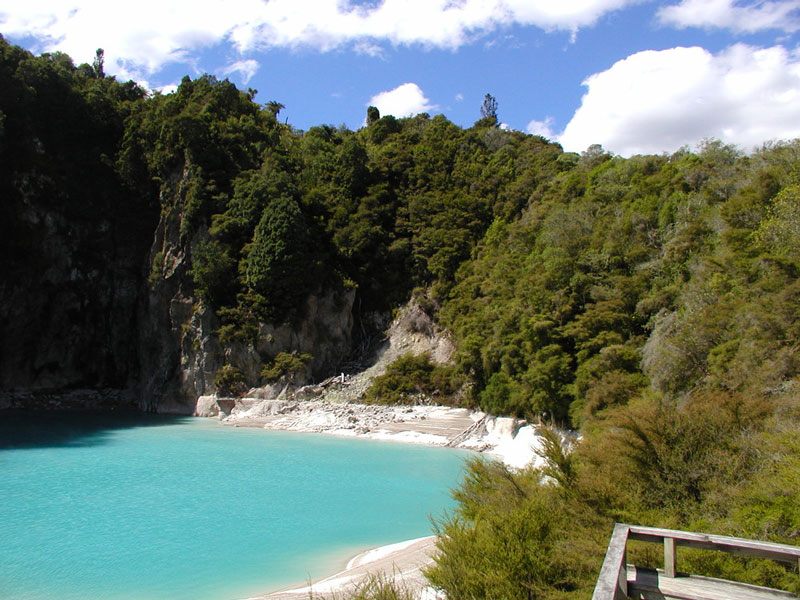
Inferno Crater lake, Waimangu.
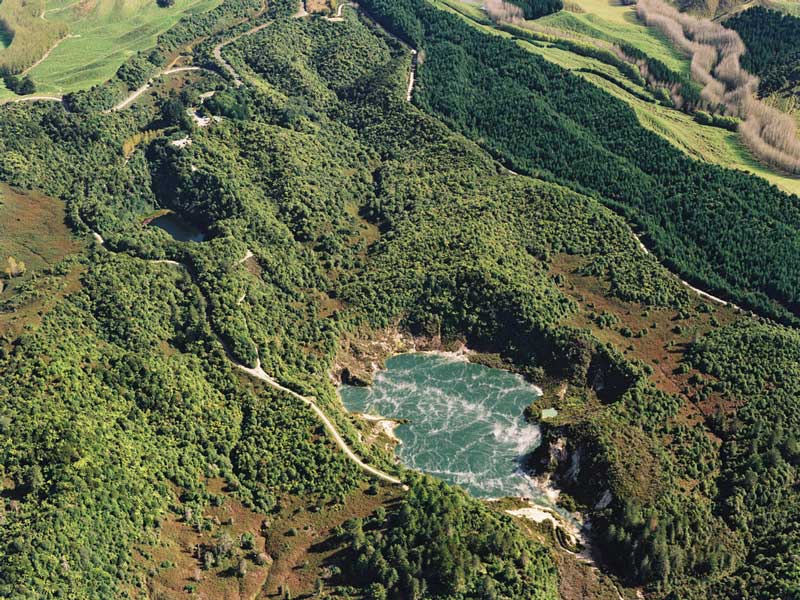
Frying Pan Lake, Inferno Crater, Waimangu.
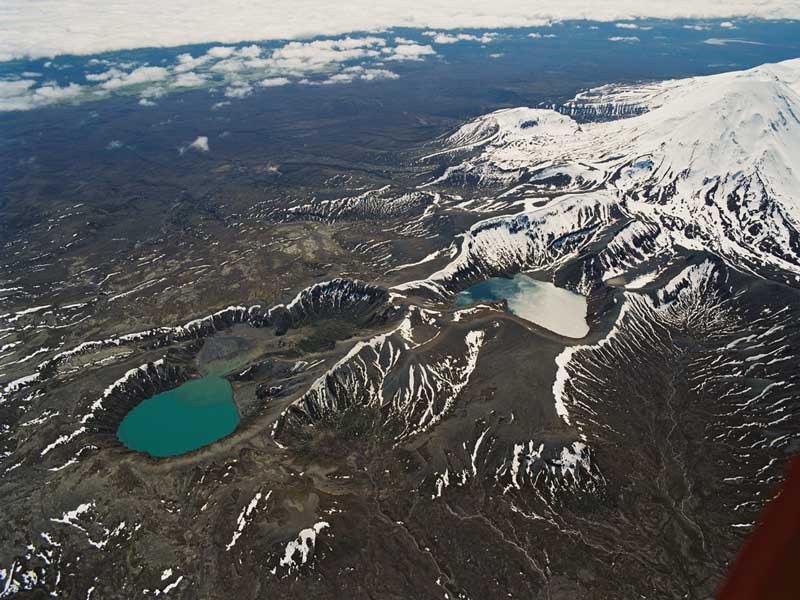
Tama Lakes explosion craters, between Mount Ruapehu and Mount Ngauruhoe.
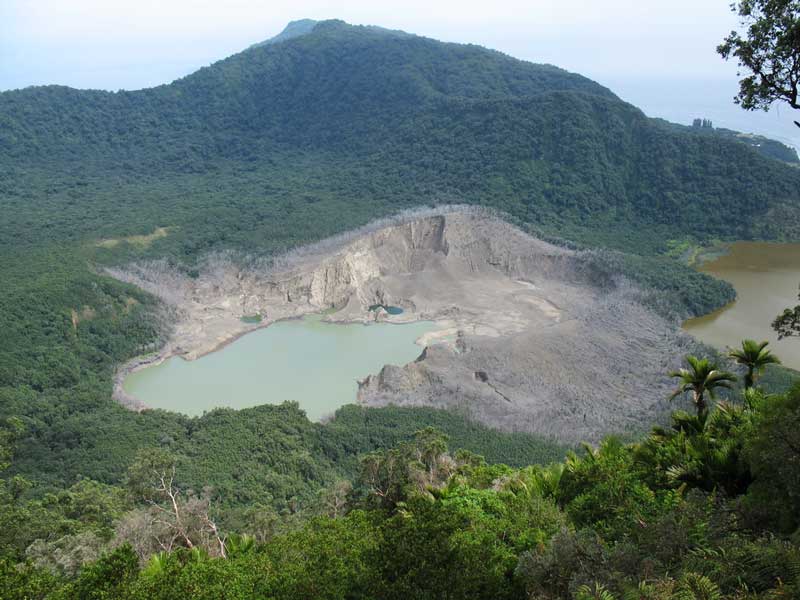
Raoul Island Crater Lake.
Why Monitor Crater Lakes?
Crater lakes occupy volcanic craters and any reactivation or change in status of an active volcano is often reflected in the lake. This may be a chemical change, a temperature increase or water level variation. Many factors can influence a crater lake.
Crater lakes come in many forms and sizes, ranging from a few tens of metres across like Frying Pan and Inferno Craters at Waimangu, to the larger lakes in craters like at Ruapehu, Raoul Island and Tongariro, to the very large caldera lakes like Rotorua and Taupō.
Raoul Island
The water level of Green Lake (at Raoul Island) rose more than six metres before the 1964 eruption started. In 1993 it rose 1.2m following an earthquake swarm, but no eruption followed. However in 2006 it didn’t change before the March eruption.
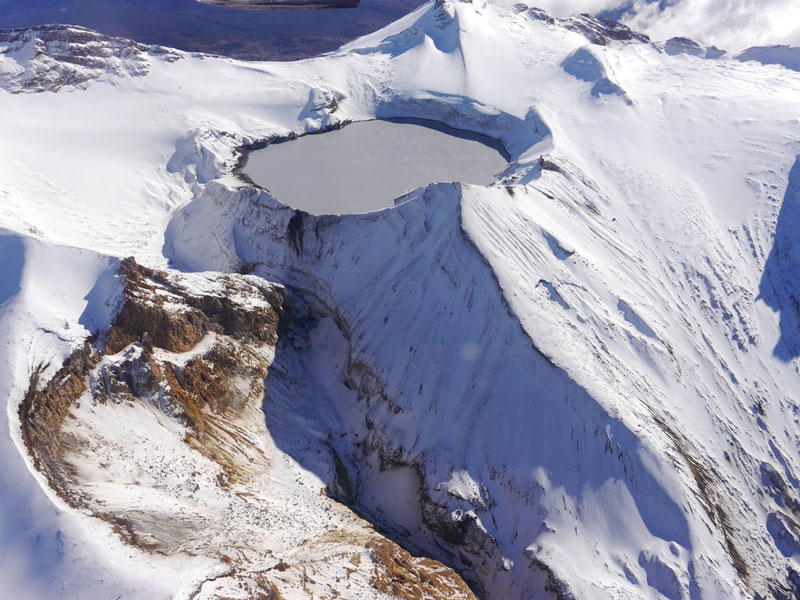
Ruapehu Crater Lake
At Ruapehu we monitor the lake temperature, water level and overflow along with the chemistry. The lake temperature varies from about 10 to 50°C; unfortunately this is not always a measure of activity as eruptions have occurred from both hot and cold lakes. The Mg (magnesium) values increase if new/fresh rock is in contact with the crater lake waters, while the Cl (chloride) changes with steam input.
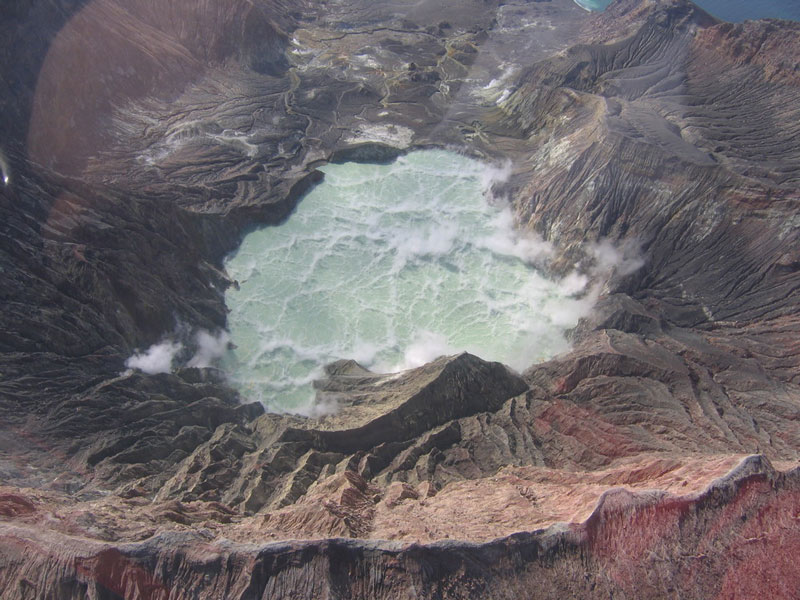
Whakaari/White Island
Crater Lakes have been a part of White Island since first observations were reported in 1826. The primary source of water filling the lake is condensing steam and gas from fumaroles and vents now beneath the lake and runoff from the surrounding crater walls. In February 2003 a large pool of water started to collect on the floor of the 1978/90 Crater Complex, drowning the vent that was active during the July 2000 eruptions. From 2005 to 2013 the lake had a cycle of filling, and then evaporating and being modified by eruptions.
By 2016 the lake had risen around 7 m, before eruptions in April excavated 13-15 m of the lake basin. A new lake did not start forming until late 2017, before being modified by the December 2019 eruption. The crater lake has remained in place since 2019 with water level varying a few metres.
Waimangu
Within the Okataina Volcanic Centre, heat flow from the large crater lakes at Waimangu have been monitored. Inferno Crater lake shows large water level variations (8-13 m) while the overflow of Frying Pan lake varies between 120 and 80 litres/sec.
Seismic Monitoring
Seismic monitoring is the most widely used of the three primary volcano monitoring methods – seismic, deformation and geochemistry. Often volcanic unrest precedes a volcanic eruption, and the most common form of unrest is unusual seismic activity. Worldwide, almost all monitored volcanoes have seismic monitoring systems and it is usually the first technique applied when scientists begin to monitor a volcano. A single monitoring station can record data from several volcanoes at once, and provide a continuous source of data, allowing rapid changes in a volcano to be monitored.
RSAM and SSAM
Volcanologists frequently use two other display techniques called RSAM and SSAM.
RSAM stands for Real-time Seismic-Amplitude Measurement. It represents the overall signal size over periods of 10 minutes. In situations when the number of earthquakes is so high that individual earthquakes can't be seen, or the level of volcanic tremor is such that seismograms no longer show a change in signal level, then RSAM is an excellent way of showing changes with time.
SSAM stands for Seismic Spectral-Amplitude Measurement. It shows the relative signal size in different frequency bands. Different seismic signals have energy at different frequencies. Using SSAM it is possible to get an idea of whether a signal is produced by earthquakes, by wind or traffic noise, or by volcanic tremor. You can read more and see the RSAM and SSAM plots here.