New Zealand Tsunami Gauge Network
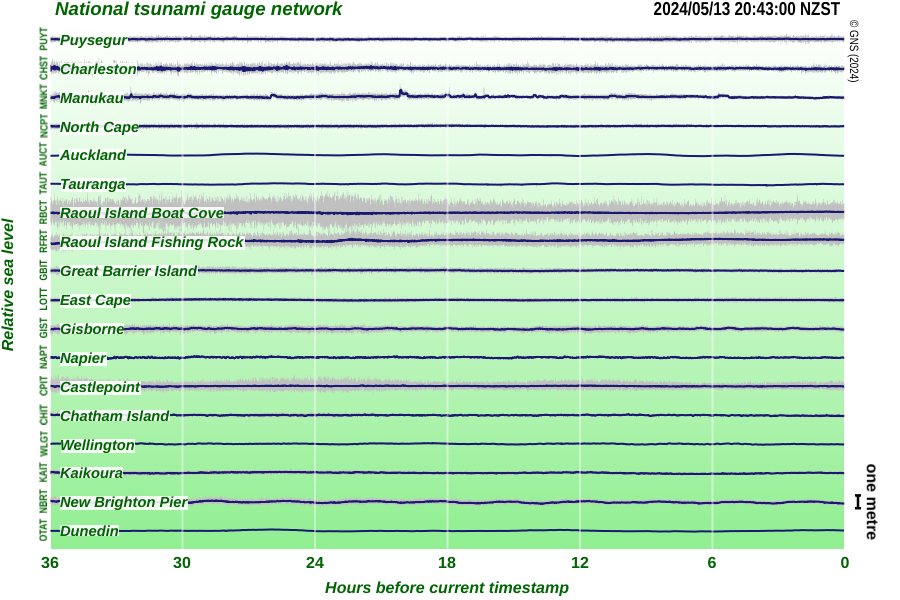

The timestamp shown at the top right of the images is the time when the images were last refreshed. The previous 36 hours of sea level variations from all operational sites are displayed, oldest to most recent from left to right. Within the sampling period of one minute, the dark part of the trace shows the average sea level height, whilst the grey part shows the maximum and minimum values.
- The most obvious feature of actual sea level recordings is the natural daily tidal variation, about 12 hours between each high or low tide
- Sheltered harbour installations such as Tauranga and Wellington show very little "grey" variation.
- De-tided readings are only available for sites where the tidal model has been computed. An initial model requires several months of data to be collected first.