M 7.2 Darfield (Canterbury) Sat, Sep 4 2010
The Darfield earthquake caused severe building damage in mid-Canterbury, particularly to the city of Christchurch. It revealed the existence of a hidden west-east fault under the gravels of the Canterbury Plains.
The magnitude 7.1 earthquake occurred at 4:35 am on 4 September, the epicentre was 40 km west of Christchurch City, and the depth of the quake was at 10 km. The epicentre was close to the town of Darfield. There was no tsunami resulting from this earthquake as it had occurred on land. It was the most damaging earthquake in New Zealand since the Hawke's Bay Earthquake in 1931, but there was no loss of life. It was fortunate the earthquake occurred when the central city streets were deserted, as there would almost certainly have been many deaths and serious injuries had it happened during a busy time of the day.
Christchurch City and its environs had only experienced three moderate earthquakes in the previous 40 years. All that changed with the Darfield earthquake, as dozens of its aftershocks caused at least moderate damage; a moderate earthquake is one that produces a shaking intensity of Modified Mercalli 6. The Darfield earthquake sequence initiated three other significant earthquakes close to the city of Christchurch:
The Canterbury Plains are covered with river gravels so we cannot see the evidence for past active faults in this region, as they are now buried. It is believed that the newly-revealed Greendale fault was pre-existing, and a patch was re-activated during the Darfield earthquake. Large (up to 700 km long) normal faults with the same strike (direction) are numerous on the Chatham Rise, out to sea east of Banks Peninsula.
- Casualties: No casualties reported
![Displacement on Clintons Road, near the intersection with Telegraph Road, Canterbury. [GNS Science]](http://static.geonet.org.nz/info/images/quakes/historic/3366146/2326658.jpg)
Displacement on Clintons Road, near the intersection with Telegraph Road, Canterbury. [GNS Science]
![Displaced tree rows off Telegraph Road, near Greendale, Canterbury. [GNS Science]](http://static.geonet.org.nz/info/images/quakes/historic/3366146/2326657.jpg)
Displaced tree rows off Telegraph Road, near Greendale, Canterbury. [GNS Science]
![Surface fracture approaching a farm shed off Kivers Road, near Burnham, Canterbury. [GNS Science]](http://static.geonet.org.nz/info/images/quakes/historic/3366146/2326656.jpg)
Surface fracture approaching a farm shed off Kivers Road, near Burnham, Canterbury. [GNS Science]
Focal Mechanisms
Focal mechanisms or fault plane solutions show the fault and direction of slip. Focal mechanisms of the Darfield earthquake and nearly a month's worth of aftershocks are shown in Fig. 1. The yellow focal mechanisms are for the main shock as derived by GeoNet (top) and USGS (bottom). The surface fault trace is shown as red line segments. The main shock (location indicated by a yellow star) has a reverse faulting mechanism. Most of the aftershocks located near the epicentre have strike-slip mechanisms. To the west, closer to the foothills, reverse faulting has also been observed, and the two mechanisms for aftershocks close to Christchurch also have a strong reverse faulting component.
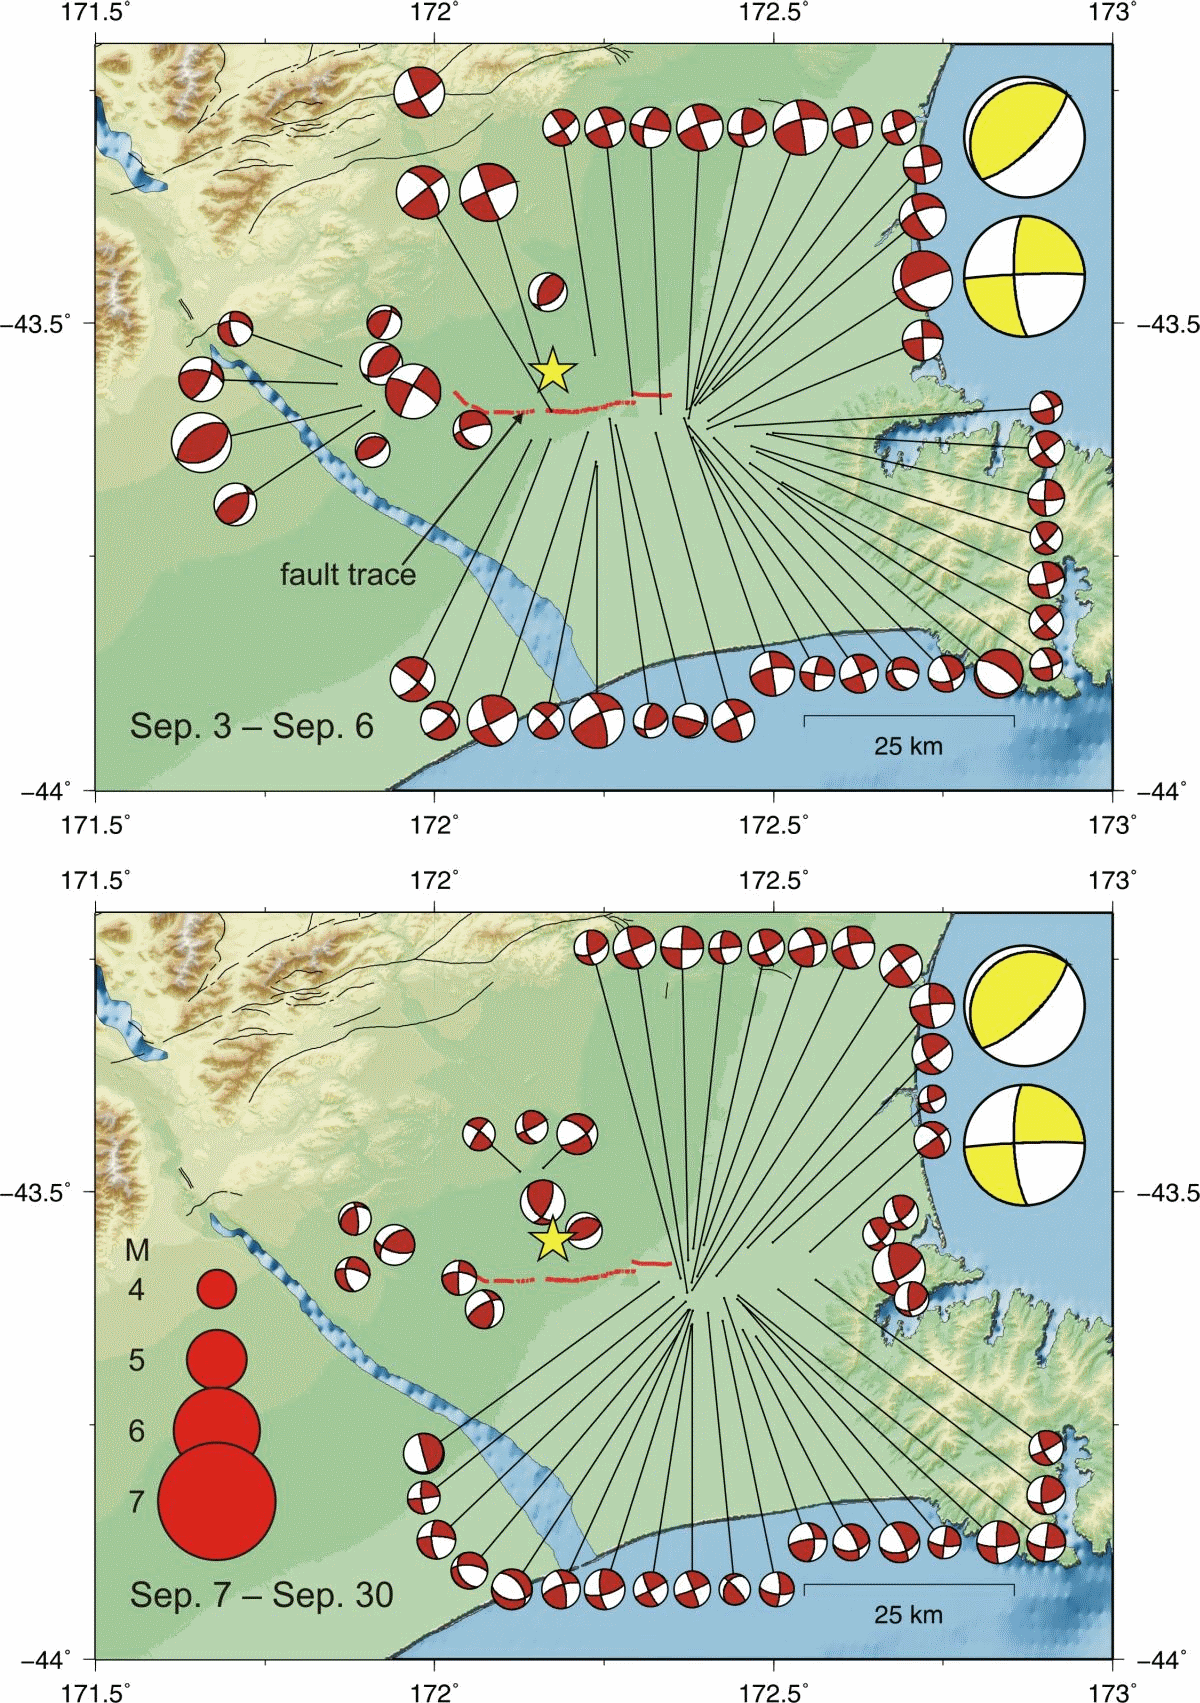
Figure 1: Focal mechanisms for the Darfield earthquake and 92 of its aftershocks. The top map is for the period 3-6 September UTC (Universal Time); the bottom map is for 7-30 September UTC.
Felt earthquake reports
The accompanying map (Fig. 2) shows shaking intensity from the Darfield earthquake for the South Island. It uses over 6,000 reports from throughout New Zealand. In areas where there is only sparse population, the intensity estimation is not particularly accurate - the white and blue regions. But in the more densely populated Canterbury (yellow and red) regions, it is apparent that the greatest shaking occurred along the same direction of the surface fault line, and was also reported up the coast from Christchurch and at some locations on Banks Peninsula.
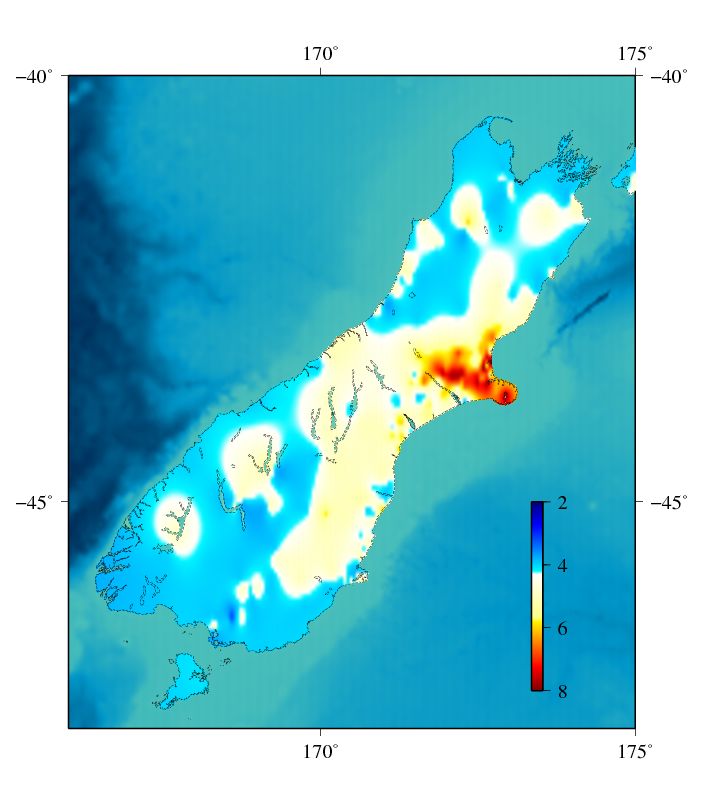
Figure 2: Intensity map compiled from felt reports.
Minor damage occurs above Modified Mercalli (MM) intensity 6 and structural damage above MM 8. Our felt report questionnaire can only determine intensities up to MM 8, although the scale itself goes as high as MM 12. Intensities above MM 9 are usually determined by engineers who inspect damaged structures in some detail.
Deformation
A GNS Science-led team including personnel from Land Information New Zealand (LINZ), Otago University and Victoria University of Wellington deployed portable instruments and occupied 74 pre-existing GPS survey marks within approximately 50 km of the earthquake, looking for changes:
- Twenty-eight were pre-existing high-quality marks, many of which were most-recently surveyed in February 2008; these marks were occupied for two days.
- Forty-six were pre-existing lower-quality (third-order) marks, which probably have pre-earthquake coordinates good to a few centimetres. These were observed with a mixture of fast-static (1-2 hour) and RTK techniques. Fig. 3 shows a map with the location of each type of survey marks.
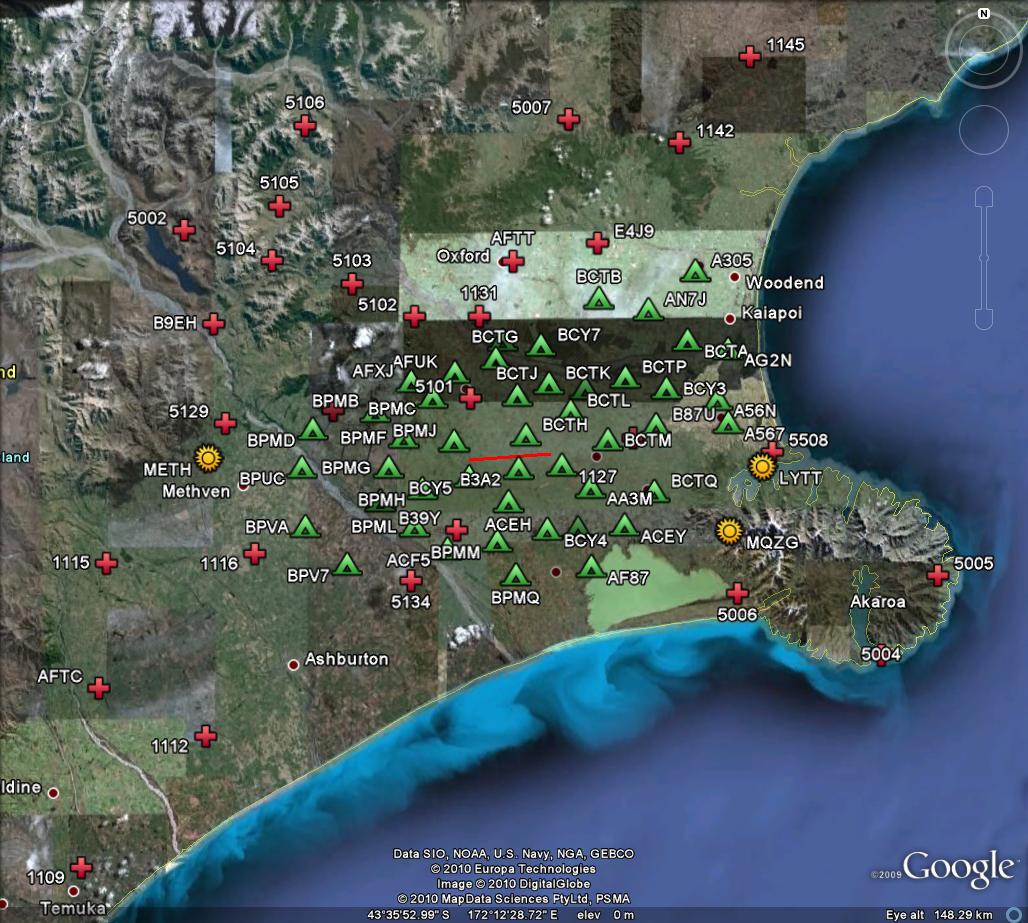
Figure 3: GPS survey sites: continuously recording (yellow circles), high accuracy (red crosses) and lower accuracy, third-order sites (green triangles). The fault trace is shown as a red line.
Engineering
The maps in Figs. 4 & 5 show Peak Ground Accelerations (PGA) caused by the mainshock recorded by GeoNet instruments. Note in particular the reading of 125%g near the epicentre; this represents an extremely rare seismic recording made near a fault rupture. 125%g means an acceleration 1.25 times that of acceleration due to gravity.
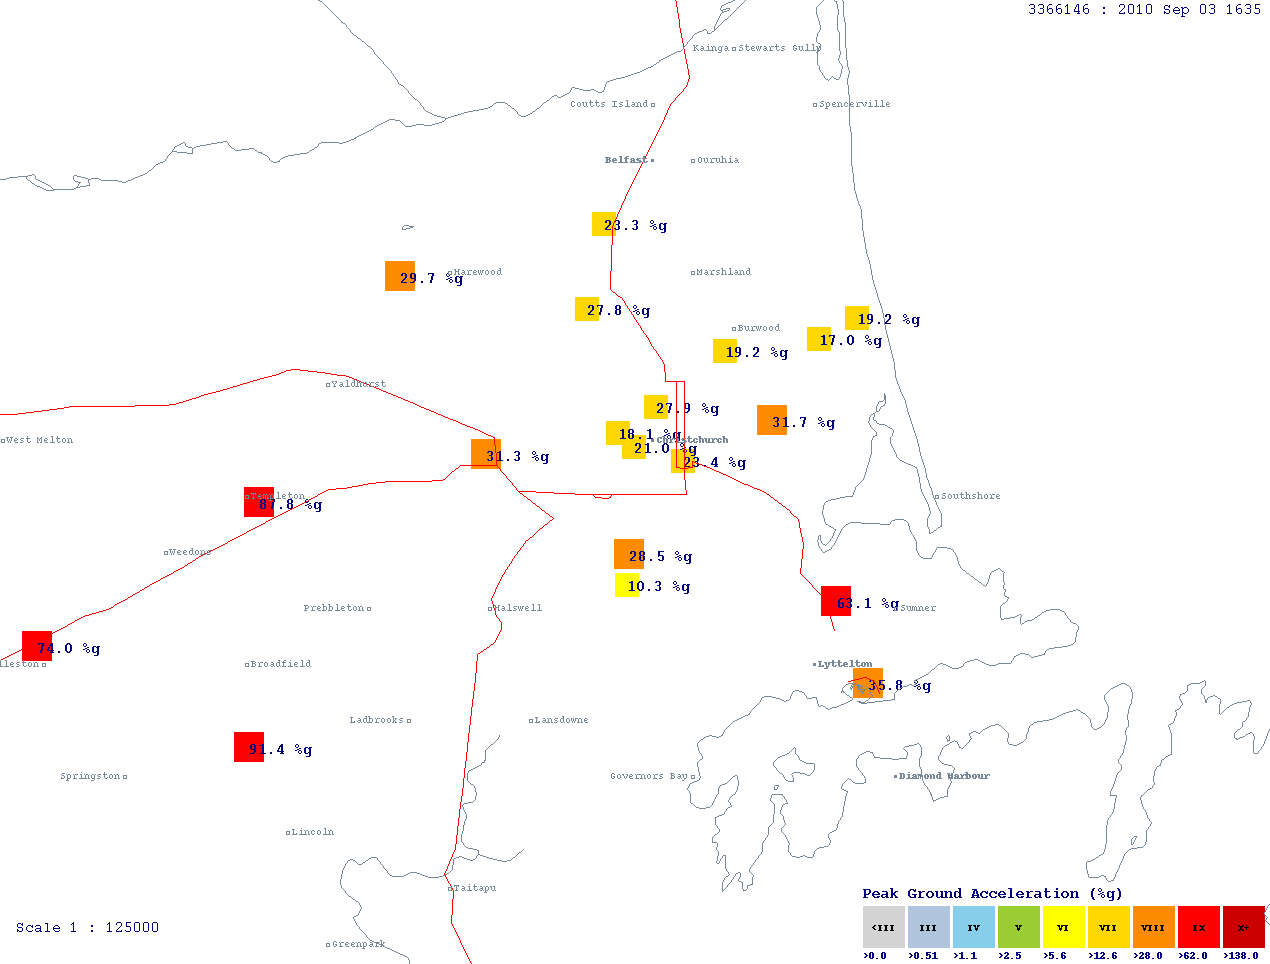
Figure 4: Regional PGA readings; epicentre marked with E. Cross-hatched colours are clipped instruments and are not reliable.
Figure 5: Christchurch CBD PGA readings.
The available strong motion data products for Darfield earthquake, together with plots of seismic waveforms and response spectra, are available from the GeoNet strong-motion site. Through the GeoNet API, a summary information of station peak motions for this event is also available (https://api.geonet.org.nz/intensity/strong/processed/3366146).
Further Information
- Previous major Canterbury quakes
- Aftershock detection and modelling
- Landslides and faulting