National Advisory: Tsunami activity – expect strong and unusual currents and unpredictable surges at the shore following the M8.8 earthquake, Kamchatka Russia. For all information please visit NEMA (The National Emergency Management Agency) Only messages issued by NEMA represent the official warning status for New Zealand.

The Built-environment Instrumentation Programme
Welcome, haere mai to another GeoNet data blog. Today, we look at the seismic structural array monitoring programme – possibly something you’ve not heard of before, and we answer some frequently asked questions.
In New Zealand where the level of seismic activity is high, it’s particularly important for engineers to understand how a building responds to earthquake shaking. The data are vital for setting seismic design regulations and understanding what needs to be done to repair vulnerable structures after earthquakes.
Back in 2007, GNS Science received funding from EQC-Toka Tū Ake for something called the Built-environment Instrumentation Programme (BeIP). This project established instrumentation of representative engineering structures in New Zealand (typical examples of things like commercial and office buildings, bridges and overpasses, hospitals, and universities) primarily for seismic performance monitoring (measuring how a building or structure shakes during an earthquake)
To do this, there are several seismic sensors installed in different places in each building, or on each structure - what we call a structural array. This lets us see how earthquake shaking affects different parts of the structures. GeoNet plays an active role in this programme through site selection, installation, and maintenance of the seismic sensors. We also look after the data and work with data users.
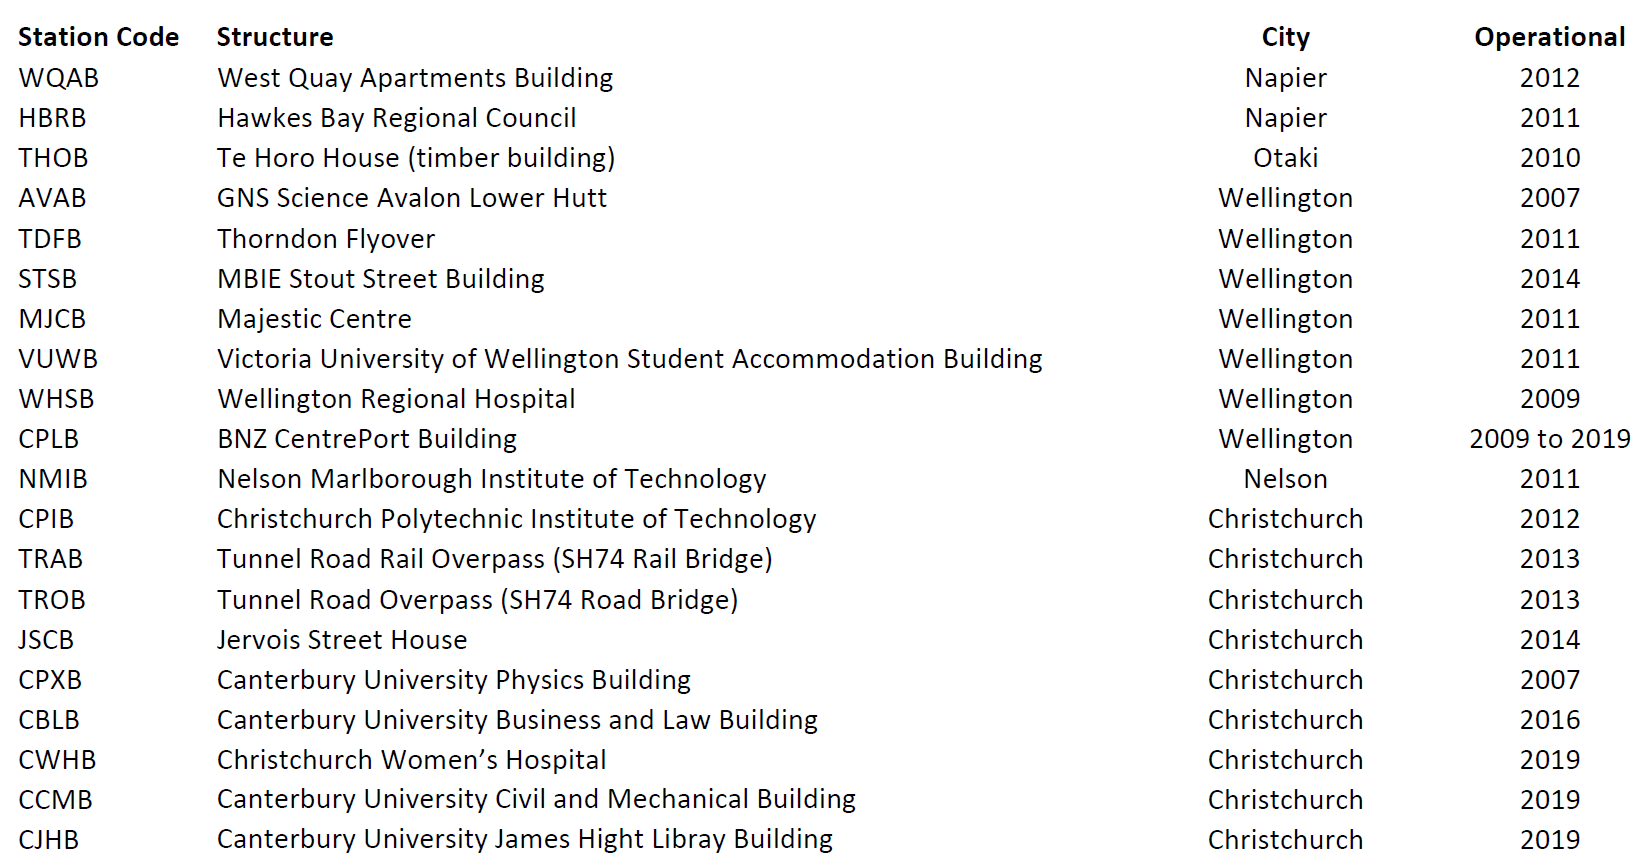
List of buildings and structures monitored by the Built-environment Instrumentation Programme
We now look at some of the most frequently asked questions we have received from our BeIP data users.
What are the sensors at the sites?
We use triaxial accelerometers - instruments that measure ground acceleration (change in speed of ground shaking) in three directions at once. All the sensors are linked to a central recording unit that records and transmits data from all the sensors. We usually also have a sensor installed separate from the building or structure that records the ground shaking at the site. In some tall buildings, we also use sensors called linear differential transducers that measure displacement.
What data are available?
We have the unprocessed time series data, direct from the instrument with no changes made.
Triggered recordings sampled at 50 Hz (samples per second) and/or 200 Hz. These are in Comma Separated Value (CSV) and Common Message Format (CMF) format, with accompanying Extensible Markup Language (XML) file for CSVs for extra metadata. There are gaps in the data because recording is triggered by a certain level of earthquake shaking. This means only the arrays that triggered for a specific event have data. The dataset is arranged by the year, by day of the year, and then the available data per array site.
From 2020, 200 Hz continuous time series data are available.
How can we access and request the data?
There are two ways to access the seismic recordings:
For additional information on array sites, a quick way to query this information is also through the FDSN webservice, although you can also grab the data from our GitHub delta repository. Here are the useful links for the metadata in GitHub -you can use the search tab and enter the station code (this is provided in the table):
As you know, the dataset is open and freely available to all, but we request our array data users to fill in and submit a request form. This way we have a mailing list which may be requested by the building owners, and we can also reach out to you for current and future updates.
Where are the sensors located in a structure?
The sensors are installed in strategic locations throughout the structures. A location code is used to tag each sensor. The location codes run from 21 to 29, followed by 2A to 2G. This represents 16 sensors deployed from ground level to higher levels in the building. Note that other buildings will have a smaller number of sensors, but the sequence of the location codes always start at 21. We do not provide engineering drawings and structural design, but we have started to provide layout diagrams that show the locations of sensors! Here is an example for TRAB – a railway over-bridge in Christchurch that has been operational since 2013.
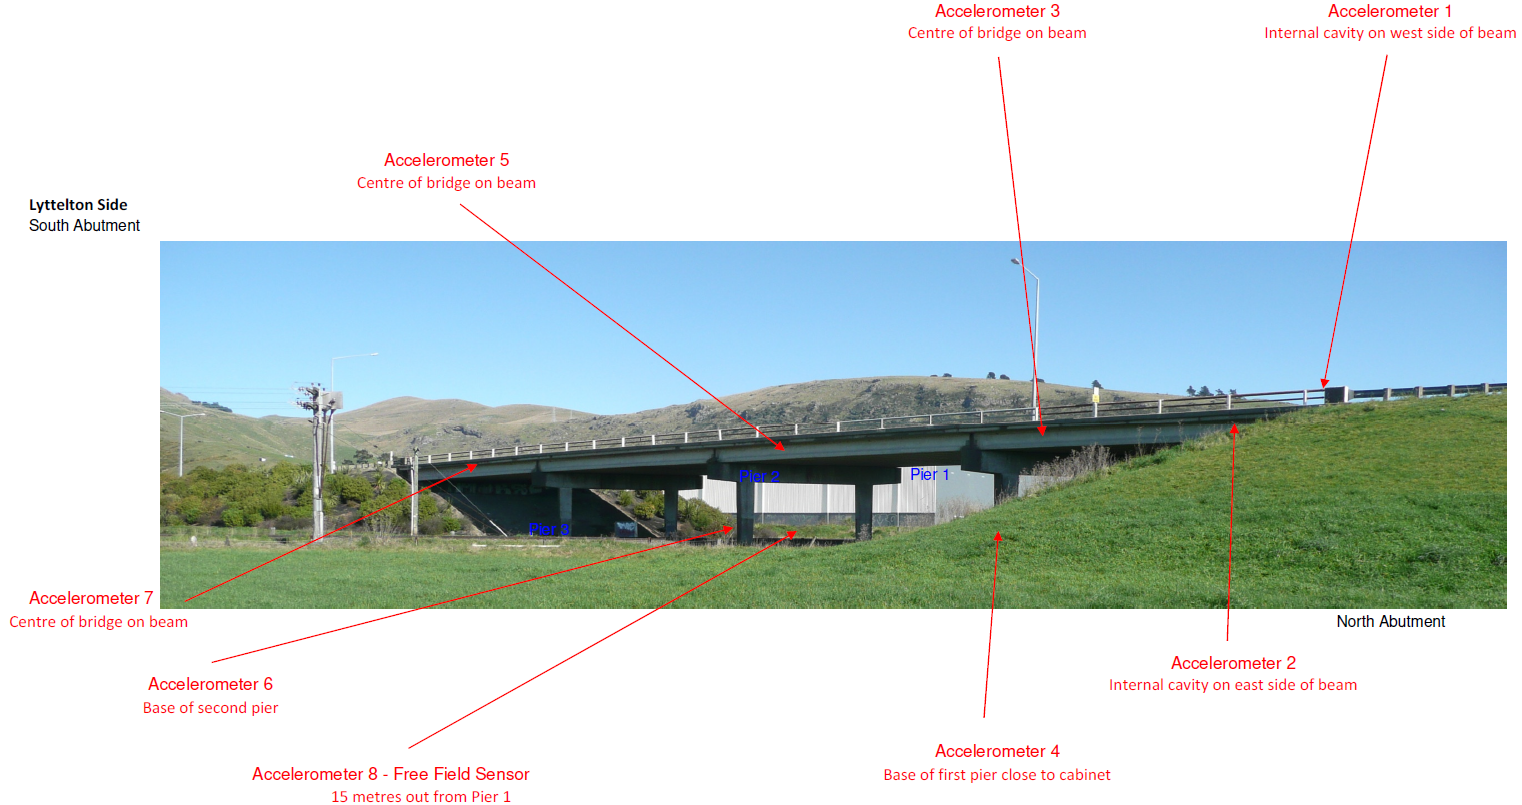
Layout diagram showing location of sensors in TRAB - a railway over-bridge in Christchurch
How does the difference in equipment configuration affect the array data compared to a typical seismic station?
A typical seismic station is equipped with either a stand-alone recorder or one sensor attached to a datalogger. For the arrays, multiple sensors are plugged into one datalogger. This multiple sensors-datalogger set up requires metadata enhancement to align with the standard convention used in ordinary seismic stations.
For example, in seismic stations we use ENZ and 12Z to describe the three axis components of the recording, representing the 2 horizontals (EN or 12) and the vertical (Z) directions. ENZ is for sensors oriented to the North while 12Z is for non-aligned orientation. In structural arrays, XYZ (instead of 12Z) is used in historical data for all sensors to have a common azimuth specific to the orientation of the structures.
Are there procedures to follow for publications that use the array data?
Yes, the data user has a responsibility to obtain the building owners’ consent for publication. GNS Science approval to publish does not imply building owner consent.
It would be great to receive a copy of the report or any unpublished research paper that uses the array data. This allows us to better understand how the data are being used, and to potentially enhance our data services to support that use.
What is in the works for the BeIP?
We are upgrading the sensors in the array sites. Out of the 19 operational array sites, 3 have recently received a new set of sensors (JCSB, VUWB and MJCB). Aligned with this work is the production of layout diagrams for sensor locations. Seismologists traditionally use sensor coordinates for locations, and they still exist for these sensors, but a layout diagram is more useful for an engineer using the data.
The expansion of the array network is also an item in the discussion. We are working with engineers and land/building owners in identifying candidate structures in major cities. Adding more sites increases the spatial coverage, and variety in structural types enhances the understanding of structure’s response in an earthquake. Exciting times, so watch out for this space!
That’s all for now. We are happy to provide further information, you can lodge a ticket in our Github help repository so other end users with similar query can easily grab further info or flick us an email at info@geonet.org.nz . For citations, here is the DOI for this dataset!
You can find our earlier blog posts through the News section on our web page just select the Data Blog filter before hitting the Search button. We welcome your feedback on our data blogs and if there are any GeoNet data topics you would like us to talk about please let us know!
Ngā mihi nui.
Contact: info@geonet.org.nz