How we monitor volcanoes
Monitoring active volcanoes requires the use of several complementary techniques to ‘take the pulse of a volcano’. Collectively, this is known as volcano monitoring. The techniques we use to monitor New Zealand’s potentially active volcanoes fall into four broad categories: visual observations, geochemistry, seismo-acoustic techniques, and measurement of ground deformation. Data from all disciplines are collected, analysed and cross-referenced, to help give an understanding of current activity and insights to future activity.
Visual and Cameras
When visiting volcanoes we make visual observations, record notes, and take photographs and video. To provide round-the-clock visual observations, we install remote cameras near volcanoes that automatically take photographs of a fixed view.
The visual observations, photographs and video obtained when we visit volcanoes are collected by trained observers who can identify interesting or unusual phenomena. The photographs and video are usually of high quality and valuable for volcano monitoring. These are available through GNS Science’s Visual Media Library.
As we are not at the volcanoes every day, our opportunities to capture photographs and video are limited. We alleviate this issue with remotely operated cameras with fixed views of some of our more active volcanoes or their vents. We commonly refer to these as webcams. The cameras we use are specifically designed for remote operation. They collect and send an image every 10 minutes to our data centres, which are then archived, and displayed on our website. The cameras also take an image every second which is stored on a memory card in the camera. The one-second images are not automatically retrieved from the cameras, but if we need more information during an eruption, or period of volcanic unrest, we can retrieve short video files from the images.
Many of the cameras are in remote locations such as in Tongariro National Park. To operate them we use solar power. Our cameras have both daylight and low light lenses, allowing pictures to be taken at night when there is enough ambient light, such as from a full moon. The advantages of webcams is that they take photographs 24x7 without us having to be at a volcano. However, being able to see the volcano typically relies on good weather.
For more details about webcams, their images, and accessing webcam data see Volcano Cameras and The Basics of Working with GeoNet’s Webcam Images.
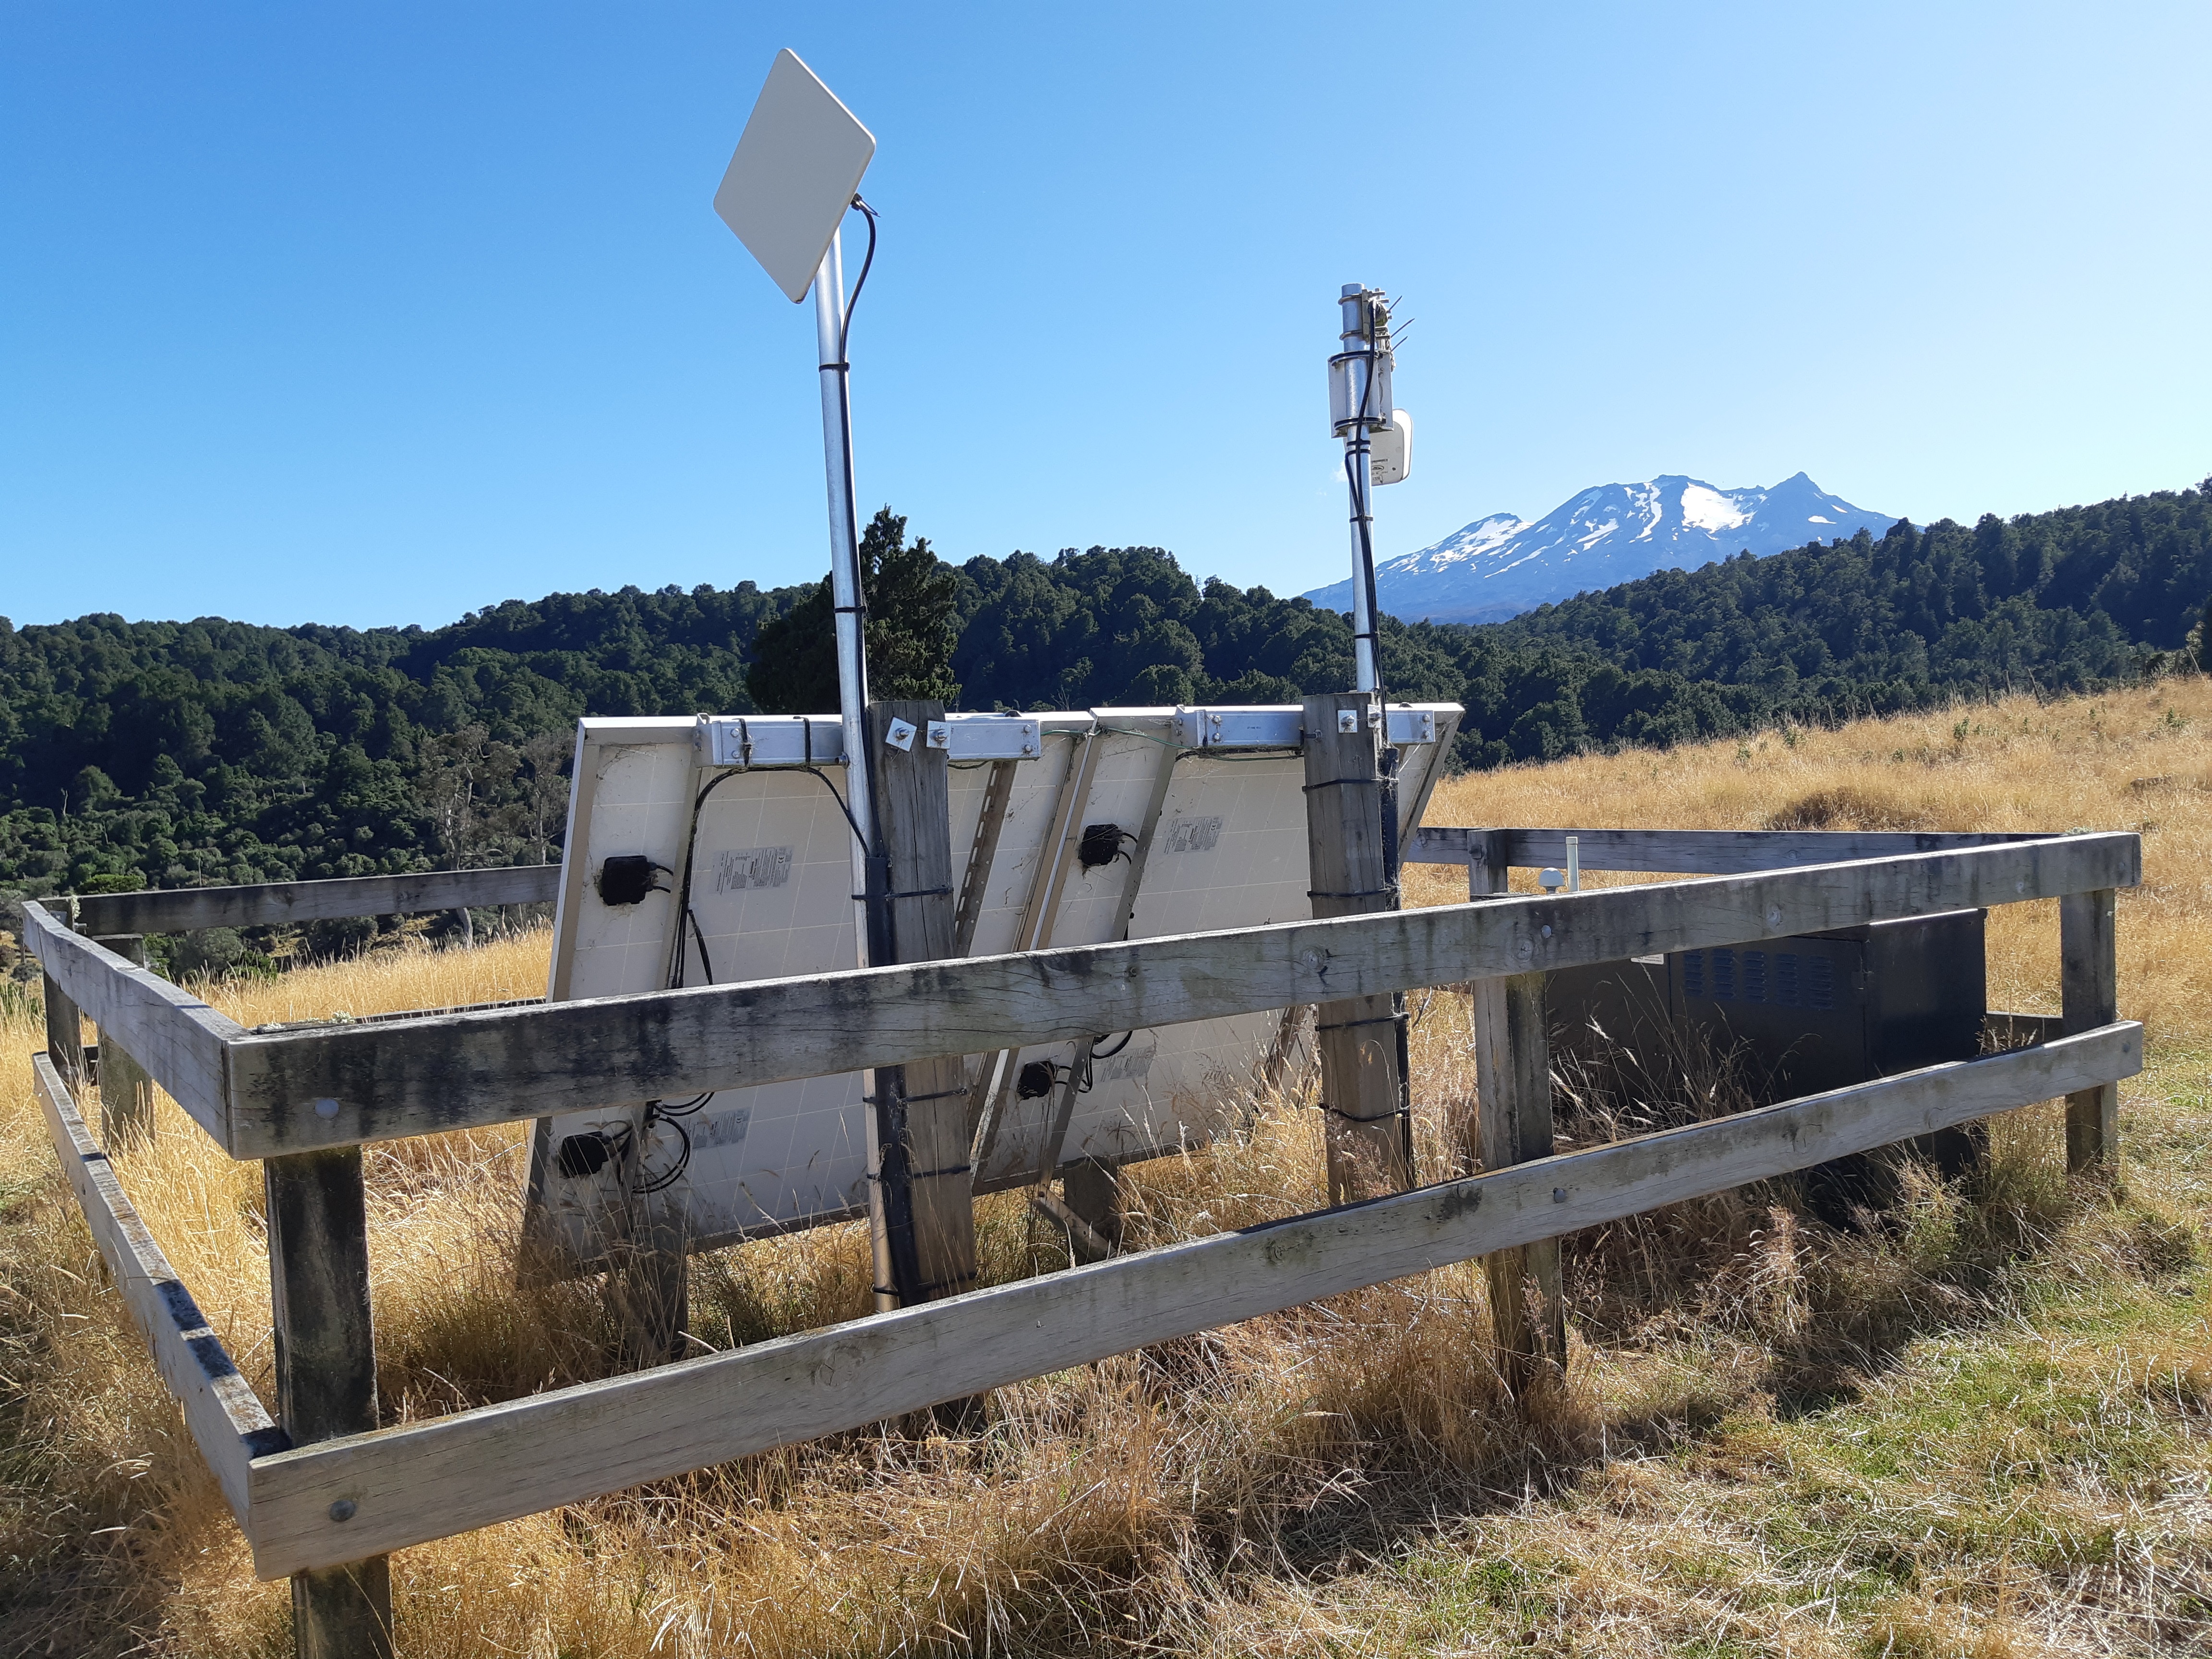
Volcano camera on south side of Ruapehu. The camera is on the pole on the right.
Geochemistry
Molten magma at depth under an active volcano releases volcanic gases, steam, and heat. These sometimes generate a geothermal system, which we might see at the surface as hot springs, pools, lakes, and fumaroles (gas vents).
Geochemistry data are available through Tilde, GeoNet's application for delivering low-rate monitoring data.
Feature Sampling
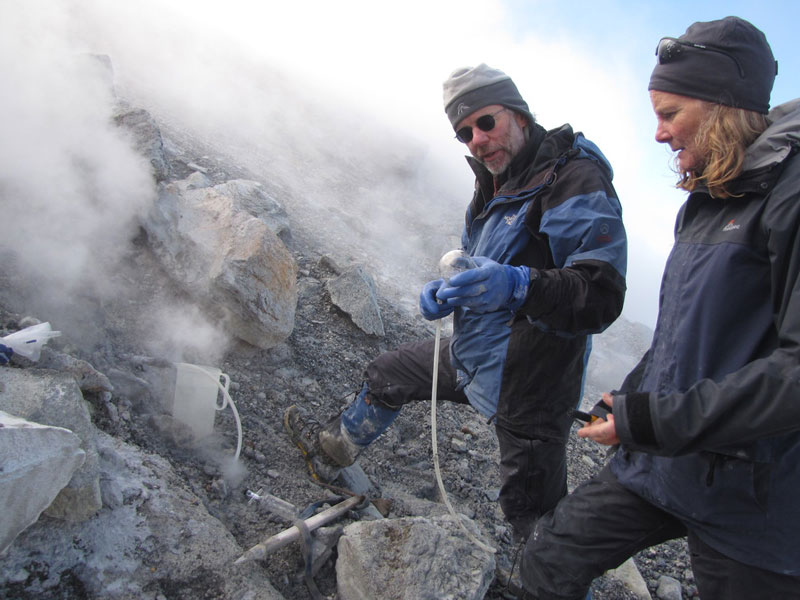
We collect samples from volcanic-geothermal features, mostly in Tongariro National Park and around the caldera volcanoes in the Rotorua-Taupo area (Te Ahi Tupua) for laboratory analysis to determine the composition of the water and gas, and measure properties such as temperature and pH (acidity level). Observing these features and how they change gives us a window into the volcano and the processes occurring there.
Gas Emission Monitoring
Some of the volcanic gas emitted from volcanoes enter the atmosphere. We measure the emission rate (or flux) of these gases using airborne and ground-based techniques. Our measurement techniques measure the concentration of various gases, and, in most cases, we then use the wind speed to convert concentrations to emission rates.
Airborne Gas Monitoring
We use aircraft fitted with special sensing equipment to fly near a volcanic gas plume to measure the concentration of carbon dioxide (CO2), sulphur dioxide (SO2) and hydrogen sulphide (H2S) gases.
Watch Karen Britten fly over active volcanoes in New Zealand to measure the amount of volcanic gases being emitted into the atmosphere.
To measure the SO2 concentration, we make use of the fact that SO2 is a strong absorber of ultraviolet (UV) light, which is emitted from the Sun. By flying under the gas plume (at right angles to the wind direction) and recording light from the sky that has passed through the plume, we can determine how much UV radiation has been absorbed by the plume and calculate the concentration of SO2. For many years, we used a Correlation Spectrometer (COSPEC) as the primary measurement device for this, but we have replaced this with a Flyspec (a miniaturized, lightweight version of a COSPEC) and a Differential Optical Absorption Spectrometer (DOAS).
CO2 and H2S gases must be measured by instruments that directly ingest the gases. We therefore need to fly an aircraft through a volcanic gas plume at different altitudes to obtain samples across the whole plume. A pump inside the aircraft sucks air into LICOR and Interscan instruments which measure the concentration of CO2 and H2S, respectively. The Interscan also provides a further measurement of SO2 concentration.

As part of sensing the concentration of gases, our volcanologists make observations of the wind speed that allows them to later convert concentrations to emission rates.
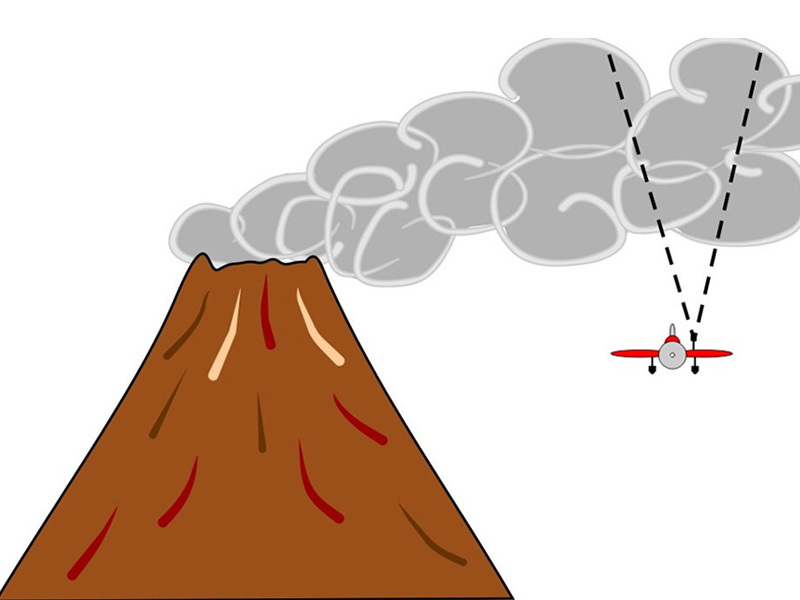
Diagram showing how Flyspec and DOAS looks up at the plume.
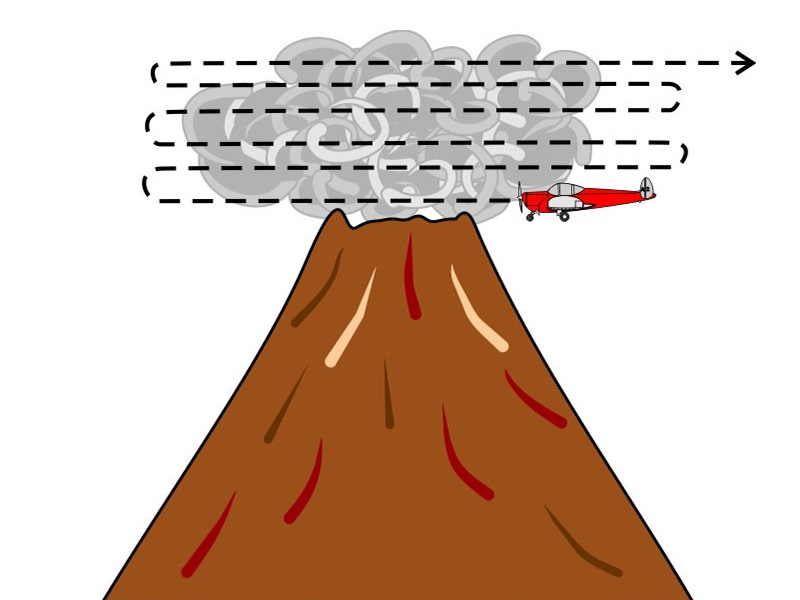
Diagram showing how the aircraft tracks through the gas plume for LICOR measurements.
Ground Based Gas Monitoring
We can also measure volcanic gases being emitted from the volcano into the atmosphere, using instruments on the ground. The advantage of this method is that we can build monitoring stations to make these measurements automatically, so we can obtain much more data than if we had to rely on airborne monitoring alone. A limitation of ground-based monitoring is that the gases can only be sensed when the wind is blowing a volcanic plume towards a monitoring station. To obtain a full set of data, several monitoring stations need to operate around each volcano (covering all wind directions).
ScanDOAS
The Differential Optical Absorption Spectrometer (DOAS) technology used for SO2 concentration measurement from aircraft is also used for our ground-based measurement. In this case, a static DOAS instrument rotates and scans a portion of the sky, so is commonly referred to as a scanDOAS. Since the method relies on UV light from the Sun, scanning occurs only in daylight hours and is effective only if the sky is bright enough. The interval between each scan is approximately 5 minutes. ScanDOAS systems operate at Ruapehu and Te Maari on Tongariro.

A scanDOAS that detects the SO2 plume at Ruapehu. The scanner is the black tube-like object at the top of pole.
MultiGas
MultiGas systems consist of CO2, SO2 and H2S sensors that are located close to features such as fumaroles that emit volcanic gases. A system of pumps and pipes directs air to each of the sensors, which in turn are connected to a data logger that collects the gas concentration values. An automatic calibration system feeds gases of known concentration to the sensors once a week. While the goal of other gas emission measurements is to estimate emission rates from gas concentrations using a local wind speed, MultiGas systems are typically used to compare the amount of CO2, SO2 and H2S gases by calculating the ratios CO2/SO2 and H2S/SO2. This is valuable because it can be used to infer the emission rates of CO2 and H2S from SO2 emission rates measured by scanDOAS measurements. MultiGas systems are operated on Tongariro and Ngauruhoe.

MultiGas monitoring station near a fumarole on Ngauruhoe.

Internal and external components of a MultiGas system.
Soil Gas Flux Measurements
As well as volcanic gases being emitted from a fumarole or a steaming volcanic crater, gas can also escape into the atmosphere through the ground surface in volcanic regions. These emissions are commonly referred to as soil gas. We can measure these with a soil gas flux meter, a bucket-shaped metal accumulation chamber placed on the ground with the gases pumped through a back-pack analyser to derive the flux/concentration. We measure carbon dioxide (CO2) and hydrogen sulphide (H2S) gases in this way.
Soil gas flux measurements were regularly made for monitoring changes at Whakaari/White Island until the 2019 eruption and have been made for mapping where gases are emitted at Raoul Island, Ngauruhoe and Tongariro volcanoes. We have also mapped gases emitted from some geothermal systems like Rotorua and Okataina.
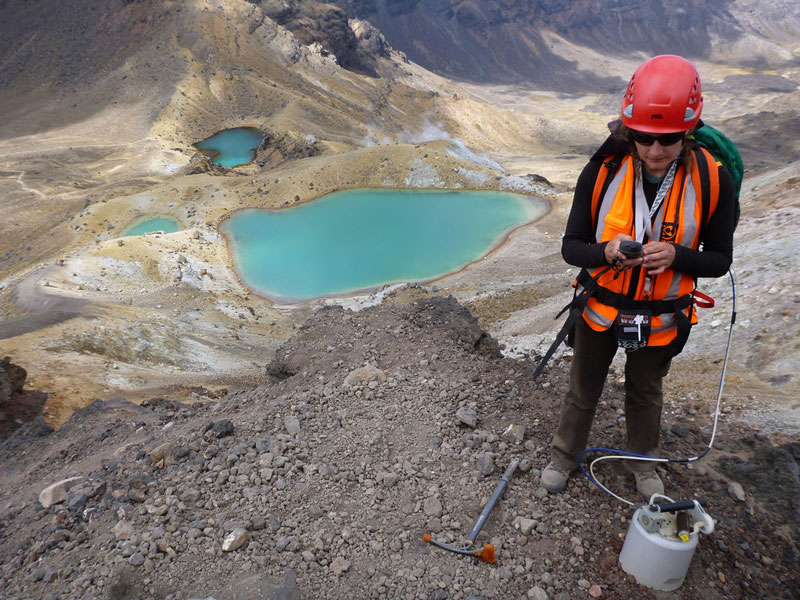
Soil Gas Flux measurements at Red Crater on Tongariro.
Ground Deformation
Another of the key techniques used in volcano monitoring is the measurement of ground deformation.
Ground deformation is a change in ground shape that can occur prior to, during or after an eruption. This can occur in response to the influx or withdrawal of molten material (magma) and hydrothermal or magmatic fluids within the volcano, or to temperature changes. Changes in the rate of ground deformation help us identify volcanic unrest that may signal the start of an eruptive episode. There are numerous ways to measure ground deformation. Today, GeoNet primarily uses its extensive Global Navigation Satellite System (GNSS) network to make ground deformation measurements. GNS Science’s InSAR (Interferometric Synthetic Aperture Radar) expertise is also used to measure volcano ground deformation from satellite radar imagery. GNSS and InSAR have replaced techniques such as levelling and triangulation that were formerly the mainstays of volcano ground deformation monitoring. However, at Taupō volcano, GeoNet still uses a technique developed in the 1980s where the lake is used as a large tiltmeter to measure vertical deformation and to supplement GNSS observations.
Global Navigation Satellite System (GNSS)
GeoNet’s GNSS network, processing and data analysis systems are very useful for volcano monitoring, with approximately 50 GNSS stations providing data in volcanic areas. With well-constructed GNSS monitoring stations and careful data processing, changes in the location of GNSS stations due to ground deformation can be resolved with an accuracy of a few millimetres.
GNSS deformation monitoring is applied at most of New Zealand’s active and potentially active volcanoes. Our GNSS stations record their position every 30 seconds which is averaged to produce hourly and daily positions.
GNSS is sometimes referred to as Global Positioning System (GPS). GPS is one of several satellite navigation systems used for positioning.
GNSS data are available through Tilde, GeoNet's application for delivering low-rate monitoring data.

A GNSS station used to monitor Taranaki Maunga
INSAR
InSAR (Interferometric Synthetic Aperture Radar) is a satellite-based technique for mapping ground deformation using radar images collected from space. Two radar images of the same area that were collected at different times from similar vantage points in space can be compared against each other. Any movement of the ground surface toward or away from the satellite can be detected and indicates how much the surface moved (deformed) during the time between images.
We regularly use InSAR to monitor Whakaari/White Island, and sometimes Ruapehu and Tongariro-Ngauruhoe, though winter snow cover can limit the effectiveness of the technique.
For information about InSAR data, please contact us.

The difference between successive InSAR images from part of the active crater at Whakaari/White Island. The basic radar image shows the shape of the topography and the coloured areas portray deformation which is the difference between the two images.
Lake Levelling
The surface of a volcanic lake can be used as a large natural tiltmeter by measuring changes in the water-surface elevation relative to a nearby stable benchmark. This is periodically done at Lake Taupō to measure the vertical component of ground deformation, continuing data collection that began in the early-1980s.
Lake levelling data are available through Tilde, GeoNet's application for delivering low-rate monitoring data.
Seismic and Acoustic/Infrasound Monitoring
Seismic monitoring refers to recording and using earthquakes and related data to identify volcanic unrest and eruptive activity. GeoNet has approximately 70 seismic stations that provide data useful for volcano monitoring. We locate earthquakes in volcanic regions and record other ground vibrations such as volcanic tremor using these instruments.
Volcano acoustic/infrasound monitoring refers to using sensors that measure changes in air pressure. These changes can be thought of as low-frequency volcano sounds. They are most commonly produced when a volcano erupts explosively, so are valuable in helping confirm if that has happened. GeoNet has approximately 20 acoustic/infrasound stations that provide data useful for volcano monitoring. The stations are at Ruapehu, Ngauruhoe, and Tongariro, at Taranaki Maunga, on the Bay of Plenty coast for Whakaari/White Island, and at Raoul Island.
Seismic and acoustic/infrasound data are primarily available through FDSN web services, with specific options for large data requests and real-time waveforms.
RSAM and SSAM
Many specialised techniques are used in the analyses of seismic data. Long periods of continuous, raw seismic data can be difficult to display in a way that is both practical and that usefully show variations that might be attributed to volcanic activity. RSAM and SSAM have been developed to do this efficiently and effectively and are particularly useful if volcanic tremor is present. You can read more about RSAM and see RSAM and SSAM plots.
RSAM (Real-time Seismic-Amplitude Measurement) represents the average seismic signal size in a fixed time interval, commonly every 10 minutes. RSAM is an excellent way of showing changes with time, especially in the level of volcanic tremor.
SSAM (Seismic Spectral-Amplitude Measurement) is a graph of the seismic signal size in different frequency bands. Different types of seismic signals have energy at different frequencies, and a SSAM graph can help decide if a signal is caused by earthquakes, volcanic tremor or by wind or traffic noise. SSAM is particularly useful in helping track changes in the frequency of volcanic tremor, which is usually difficult to see in raw seismic data.
For information about RSAM and SSAM data, please contact us.
Physical Properties of Fumaroles, Volcanic Lakes, and Hot Springs (Envirosensor Network)
Complimenting manual observations and sampling of fumaroles, volcanic lakes, and hot springs, we also use permanently installed sensors to collect a limited range of environmental data with automatic data loggers. This is referred to as our envirosensor network. The network has more than 10 stations collecting volcano monitoring data. The most common properties measured are temperature and water level but ground self-potential and rainfall are also measured. The MultiGas CO2, SO2 and H2S monitoring system is also a part of the envirosensor network.
The envirosensor network includes monitoring of Green Lake at Raoul Island, where temperature and water level changes have occurred before some eruptions; fumaroles and hot springs on Tongariro, some of which showed changes before the 2012 eruptions; and Inferno Crater at Waimangu, which typically displays temperature variations of over 40 oC and water level variations of more than 8 metres about every 40 days.
The envirosensor network has replaced most manual measurements of temperature and water levels for volcanic feature monitoring. It has the advantage that it collects an observation every 10 minutes and is much more likely to detect a short to medium-term change than manual observations.
Envirosensor data are available through Tilde, GeoNet's application for delivering low-rate monitoring data.

An envirosensor site measuring fumarole temperature on Tongariro. The data logger is out of the picture, in a cabinet a safe distance from the hot, steaming ground.