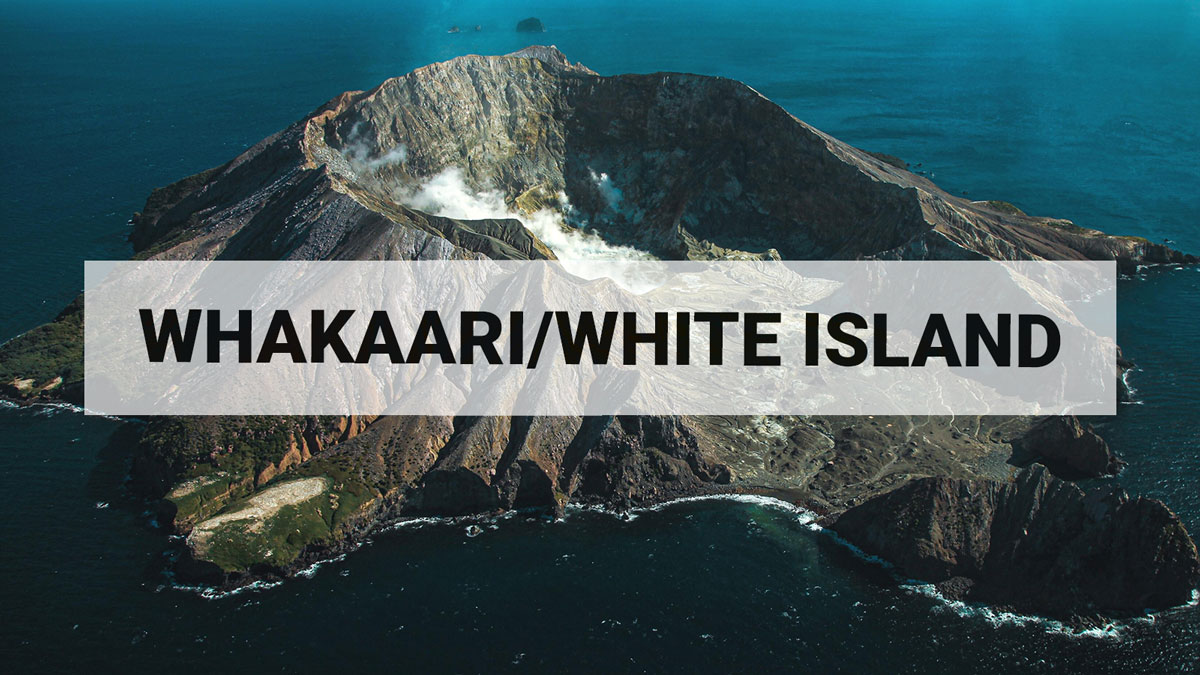
Steam and gas emissions continue at Whakaari/White Island. Volcanic Alert Level remains at 2.
Based on recent observations from webcam images, a gas flight, and satellite imagery, activity at Whakaari/White Island continues with steam and gas emissions. Activity has been consistent over the past 2 months, with no eruptive activity. The Volcanic Alert Level remains at 2 and the Aviation Colour Code at Yellow.

Citizen science and GeoNet data
Welcome, haere mai to another GeoNet Data Blog. Today’s blog talks about citizen science and how GeoNet works in that area.
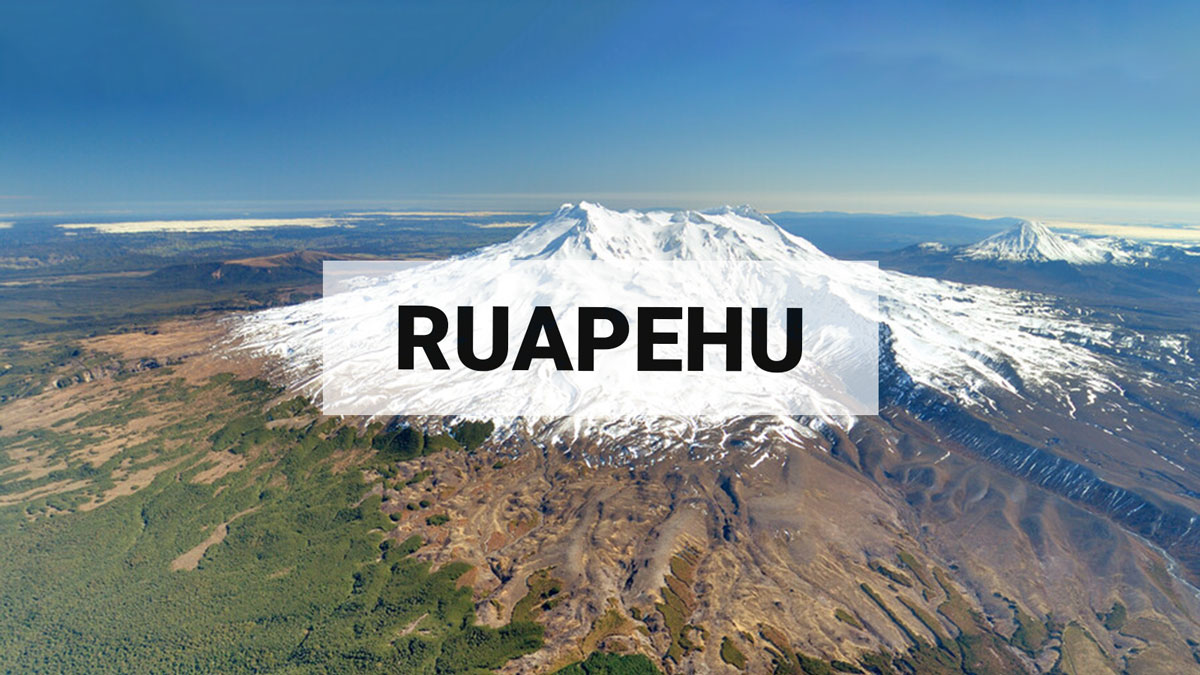
Update on Ruapehu: Slight increase in heat flow and gas output, continued small earthquakes beneath summit. Volcanic Alert Level remains at Level 1.
Since the last update in late April, Mt Ruapehu has continued to show low-level unrest, characterised by persistent small earthquakes beneath the summit area, minor fluctuations in Te Wai ā-moe (Ruapehu Crater Lake) temperature, and variable but generally low-to-moderate gas emissions. Volcanic activity remains within the range typical for minor unrest. The Volcanic Alert Level therefore remains at Level 1.
Whakaari/White Island has been erupting on and off since May 2024, so we thought we’d take a deeper dive into recent activity and summarise the info we’ve provided in our Volcanic Activity Bulletins.
Data access mechanisms
Welcome, haere mai to another GeoNet Data Blog. Today’s blog talks about some of our data access mechanisms.
Update on Ruapehu: Lake temperature remains steady, small earthquakes under summit. Volcanic Alert Level remains Level 1
Since the last Ruapehu update in February, lake temperatures and gas emissions have remained stable. We have observed a small increase in seismic activity under the summit from mid-March to early-April. No noticeable change has been observed in Crater Lake composition. The Volcanic Alert Level at Ruapehu remains at Level 1 and the Aviation Colour Code at Green.

Ongoing heavy rain and flash flooding since the weekend have heightened the risk of landslides, and people are urged to be prepared and know the warning signs.
With Cyclone Vaianu forecast to hit the North Island this weekend, now is the time to get prepared and know the warning signs for landslides.

No eruptive activity or ash emissions observed from Whakaari/White Island since 24 March. Volcanic Alert Level remains at 2 and Aviation Colour Code lowered to Yellow.
No further eruptive activity or ash emissions have been observed at Whakaari/White Island since Tuesday 24 March. Observations from an overflight on 4 April showed a weak steam-only plume rising above the island. The Volcanic Alert Level remains at 2 and the Aviation Colour Code is lowered to Yellow.
No further ash emissions detected from Whakaari/White Island. Volcanic Alert Level lowered to 2 and Aviation Colour code remains at Orange.
No further ash emission has been observed at Whakaari/White Island since Tuesday 24 March. The Volcanic Alert Level is lowered to 2 and the Aviation Colour Code remains at Orange. While no eruptive activity has been observed since Tuesday, the likelihood of further ash emission remains elevated.