National Advisory: Tsunami activity – expect strong and unusual currents and unpredictable surges at the shore following the M8.8 earthquake, Kamchatka Russia. For all information please visit NEMA (The National Emergency Management Agency) Only messages issued by NEMA represent the official warning status for New Zealand.
Whakaari/White Island more Frequently Asked Questions
Our thoughts continue to be with the families and friends of the people who lost their lives and were injured in the eruption on 9 December 2019, and all those still involved in the recovery and response efforts.
What does the Crater Lake look like now?
This morning, we had one of our experienced volcanologists along to observe the active vent area during the NZ police recovery operation. He was able to obtain some great observations and images for us. The following photo was taken by him during this advisory flight, at a safe distance.
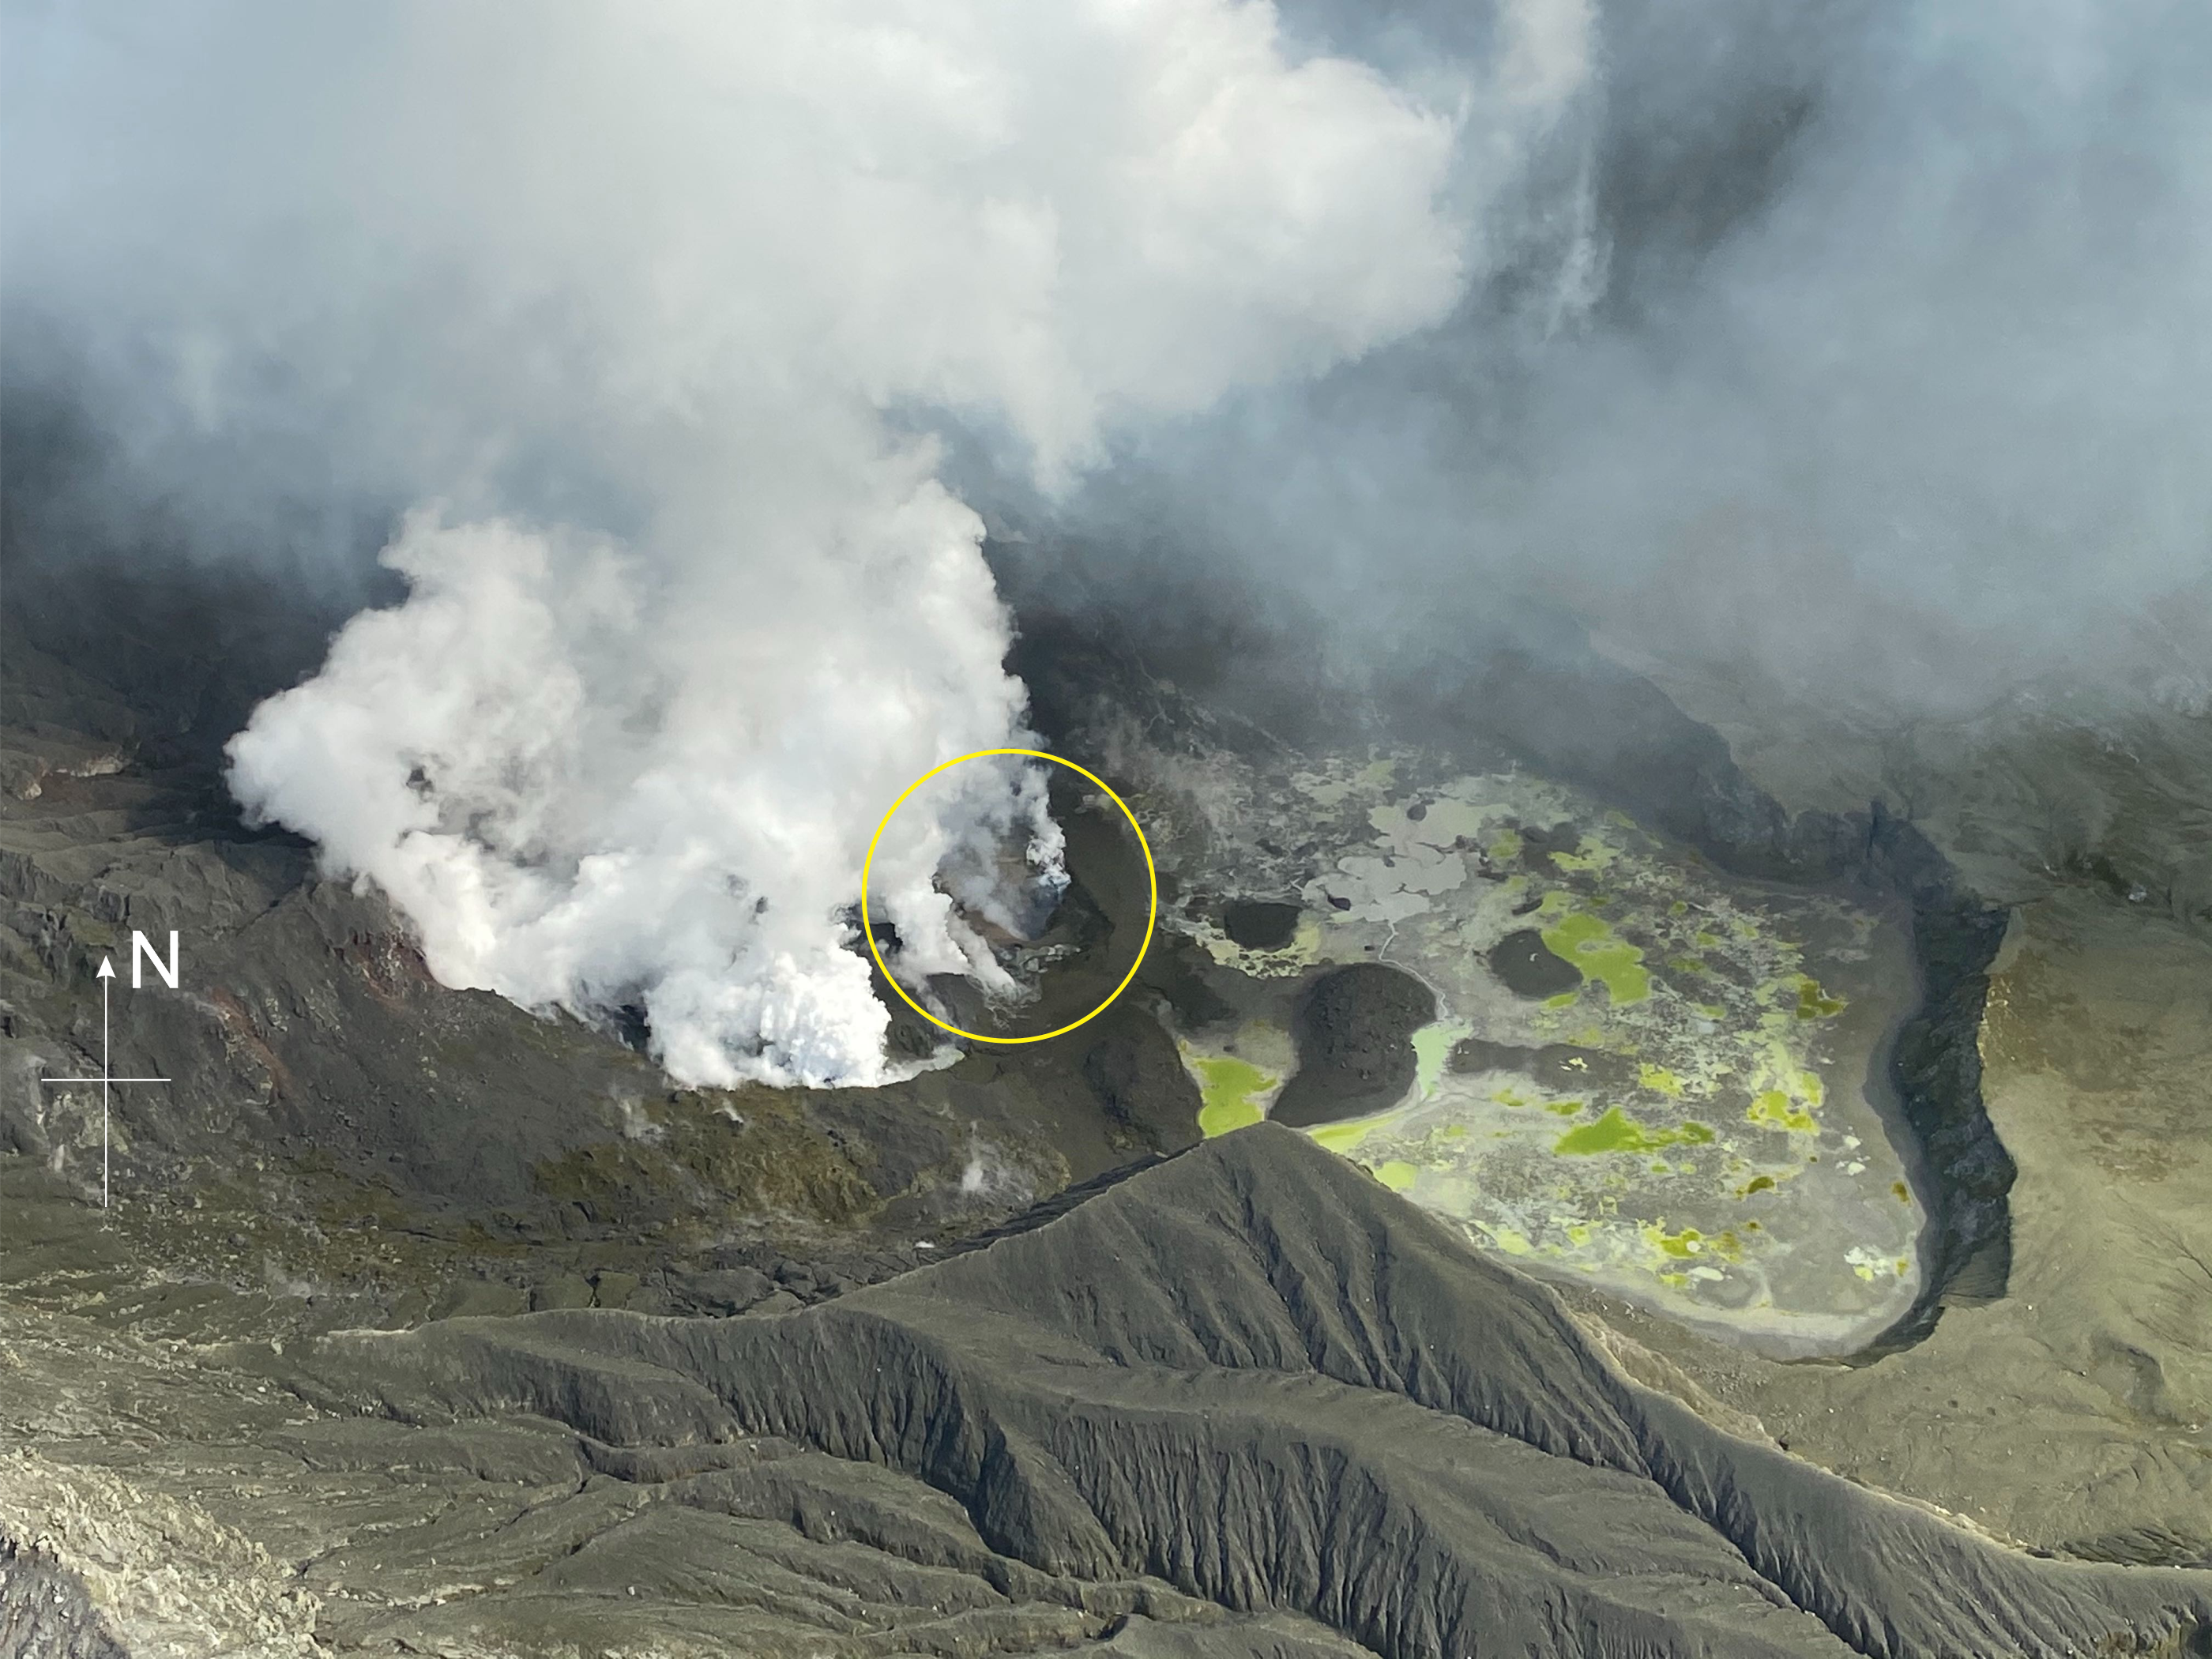
White Island crater area showing the active vent (circled).
We can see at least one active vent with a high rate of gas coming out of it (circled) temperatures of the gas are hot (at least 200 °C), and the blue tinge indicates that it is dominated by sulphur dioxide (SO2), which comes directly from the shallow magma (magma is molten rock). To us, it looks like a typical open vent volcanic system with magma not too far below the surface, possibly as shallow as a few 10s of metres beneath the surface. The other feature that shows very clearly is the former Crater Lake basin, a depression that was formed by eruptions between 1978 and 1990. Before Monday’s eruption, this basin was partially filled by a hot, acidic lake that was about 16 metres below over flow. Now much of the basin is infilled with debris with numerous, isolated ponds. Much of the ponded water is from recent rainfall that has been reacting with the eruption deposits.
What is the ‘glow’ in the crater area we have been talking about?
Since Friday evening, we have also observed and reported a ‘glow’ within the active area. We can see this on the specialised low light cameras that we use to obtain images at night. This glow represents high heat in the gases and light from external sources like the moon. The cameras are not true thermal InfraRed but work in a similar fashion.
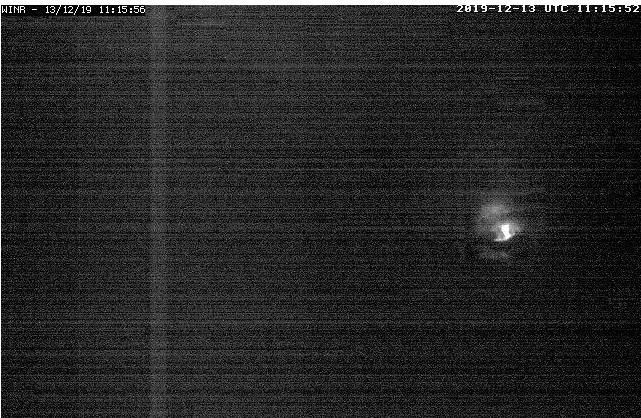
Crater area 'glow'
Is there ash above the volcano?
Below is a typical visual image (taken during Sunday morning’s NZ Police mission) showing the vivid white steam and gas plume above the volcano. It changes as it moves away down wind, cooling to a less visible plume (toward eastern Bay of Plenty and the northern end of East Cape) Close to the volcano, the plume appears as a white cloud, and as it cools and trails away, sunlight highlights the gas particles. These gas particles appear as a dull grey or brown colour.
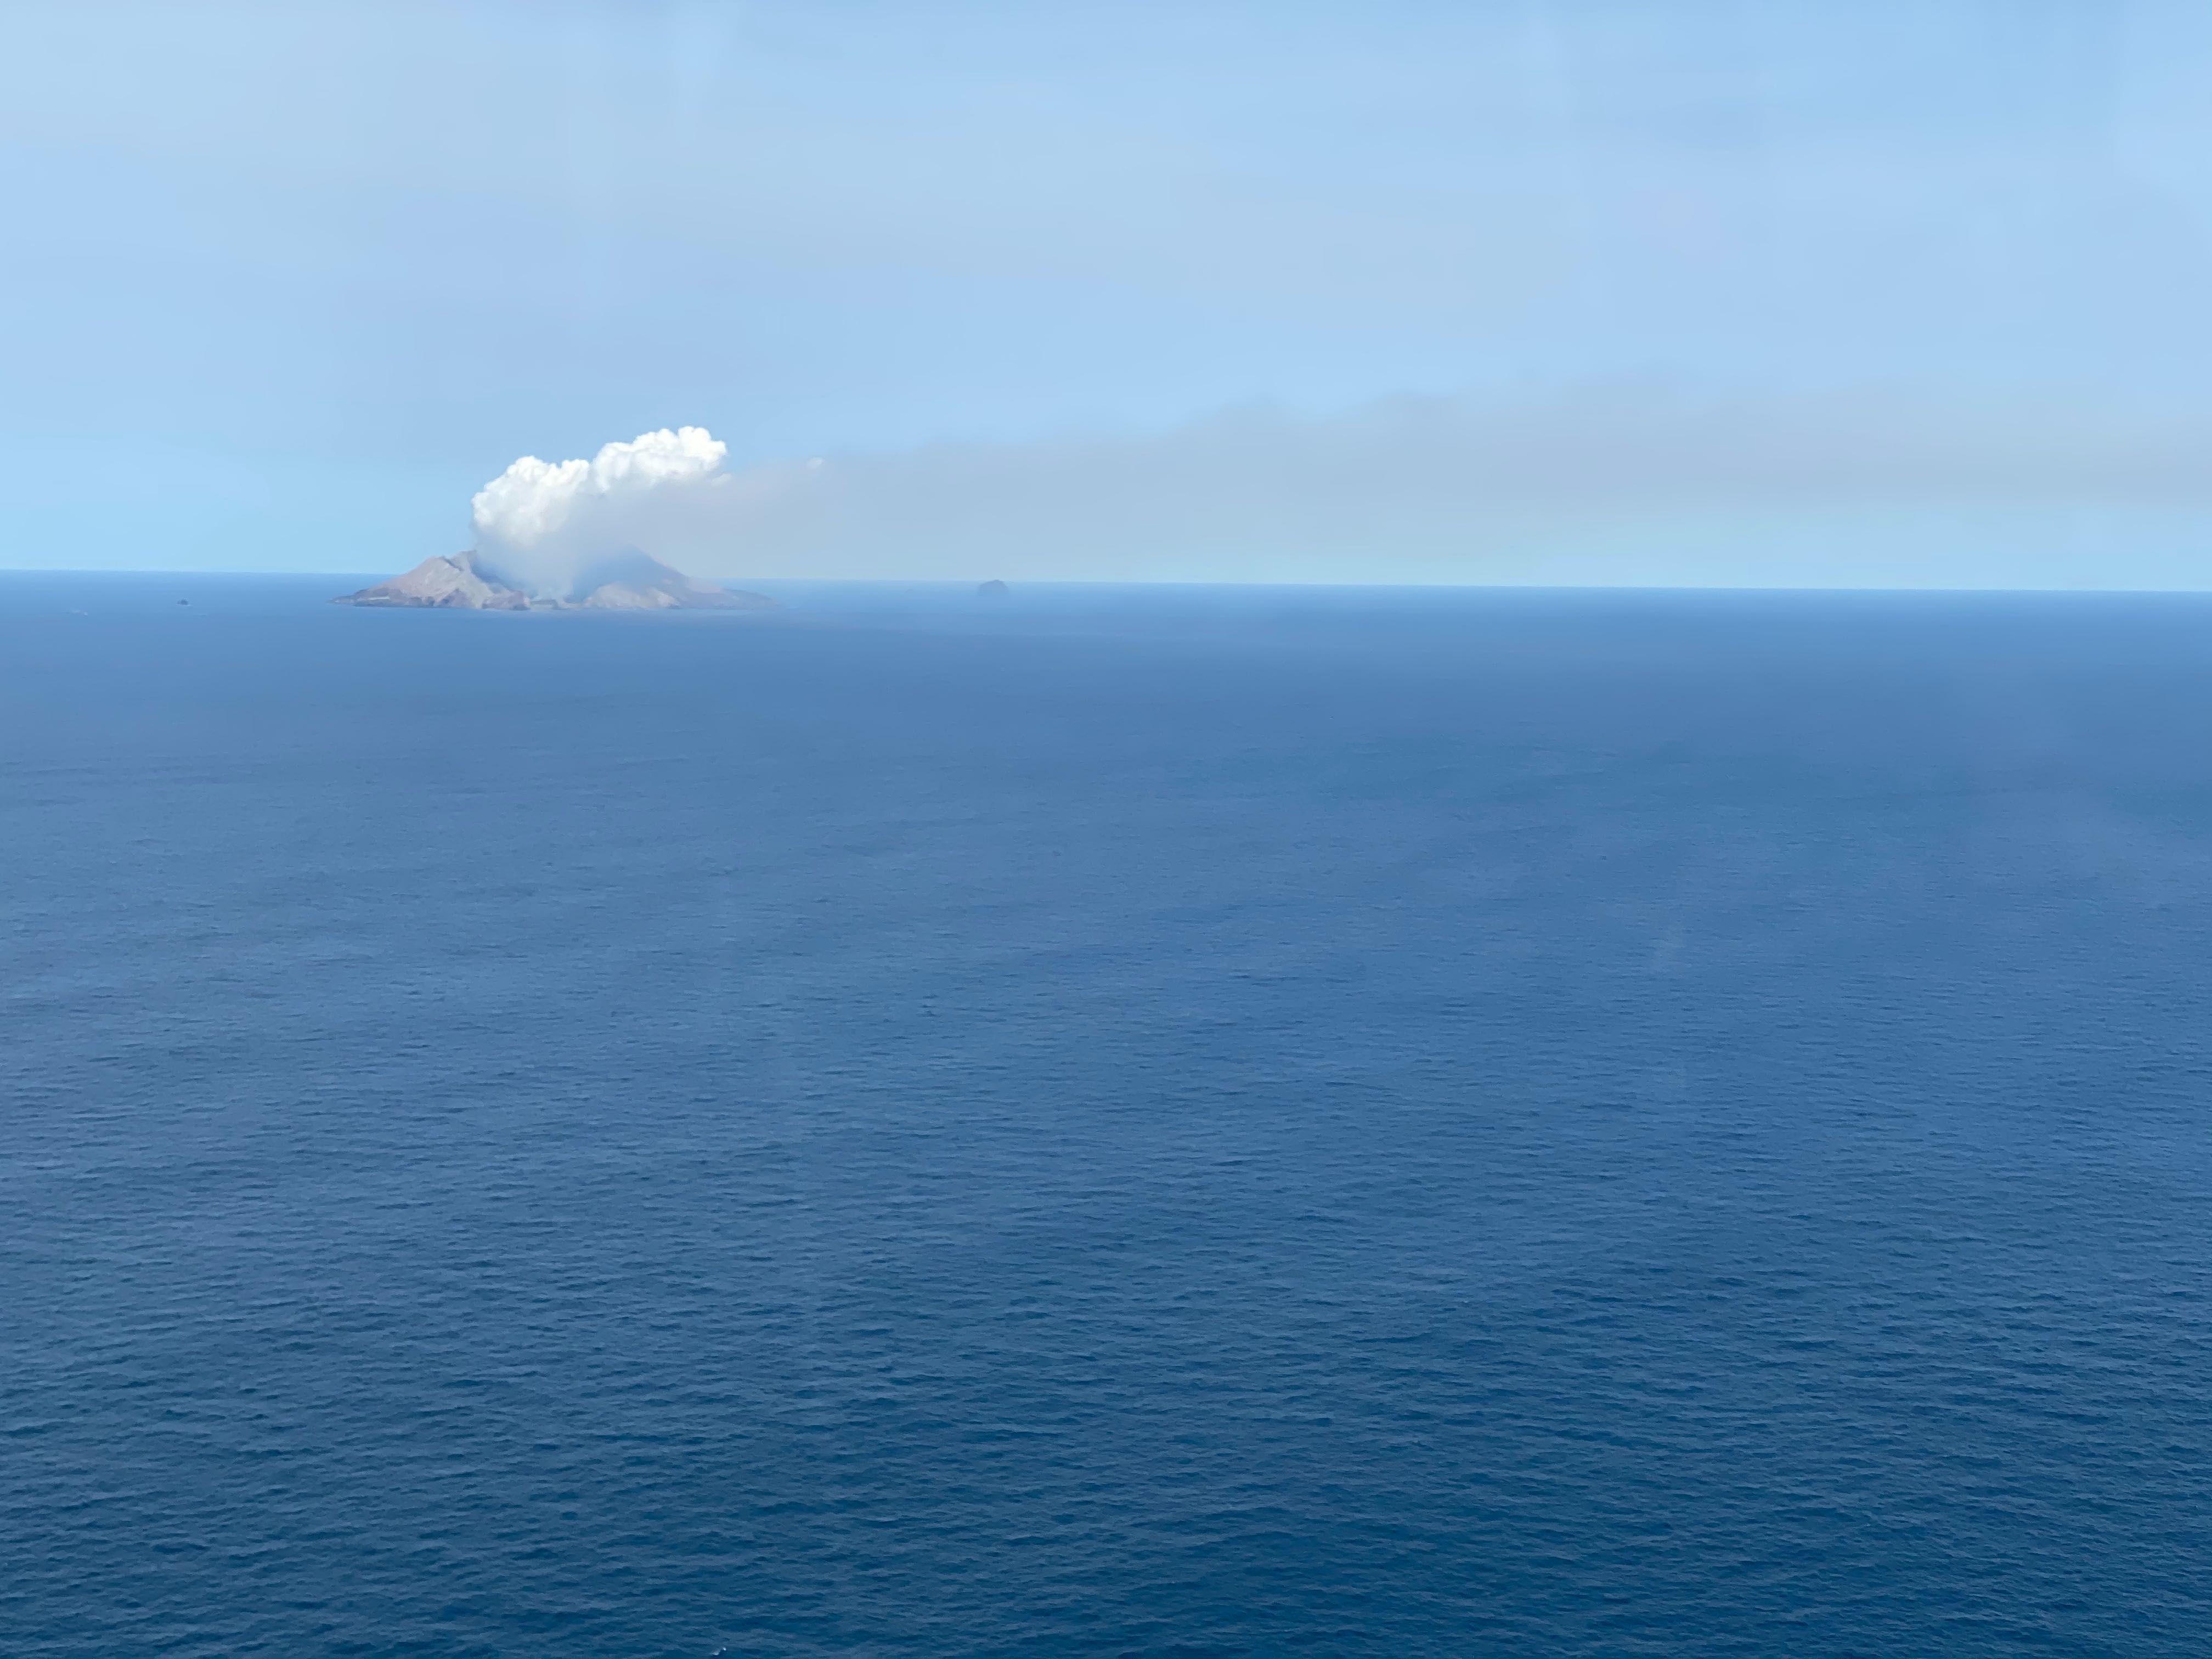
The vivid white steam and gas plume above the volcano
We have been expecting more explosive activity and possibly some minor ash producing events, however these have not happened to date. There has been some concern as to what this could mean for residents in the Bay of Plenty. Ash producing eruptions at Whakaari/White Island produce very fine ash (usually less than 1-5 mm in size). By the time it reaches the coast (50+ km away) all the larger particles have dropped out and only very fine ash is left. This usually looks like pollen or talcum powder when it lands onshore. There is an extremely low likelihood of any potential ash affecting the mainland.
The gas plume can also make it ashore and people will be able to smell the distinctive sulphur odour. Again, this is a nuisance unless someone has a respiratory disorder. Check with your GP if you are concerned.
What is happening with the volcanic tremor?
Seismometers are a vital monitoring tool used at active volcanoes because it allows us to measure volcanic tremor and volcanic earthquakes. We display this in two forms, the 24 hr ‘drum plots’ you see on our website and as RSAM (Real Time Seismic Amplitude) time series plots. The RSAM plots help see how much ‘energy’ the volcano is producing. This doesn’t always tell us where this is coming from or what the source is, but it does help when the drums get busy by overlapping data. You can see the variability in the RSAM plot below, it starts with the increase above background and some variable cycling of energy release. Then we see the eruption and strong response afterwards for a few days, and how it has shut down now.
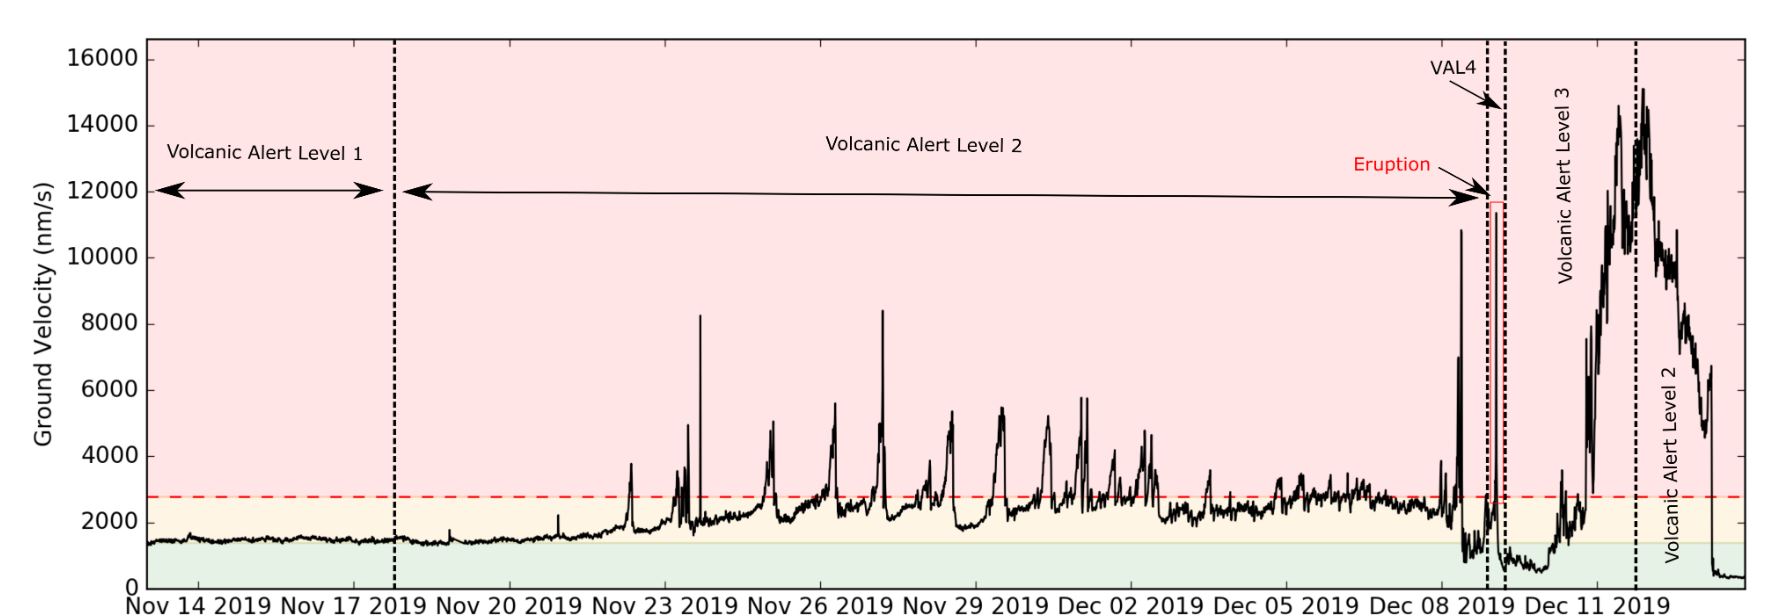
RSAM Eruption Timeline
The image below shows how busy the website drum was a few days after the eruption(Dec 12), compared with a quieter day today (Dec 15).
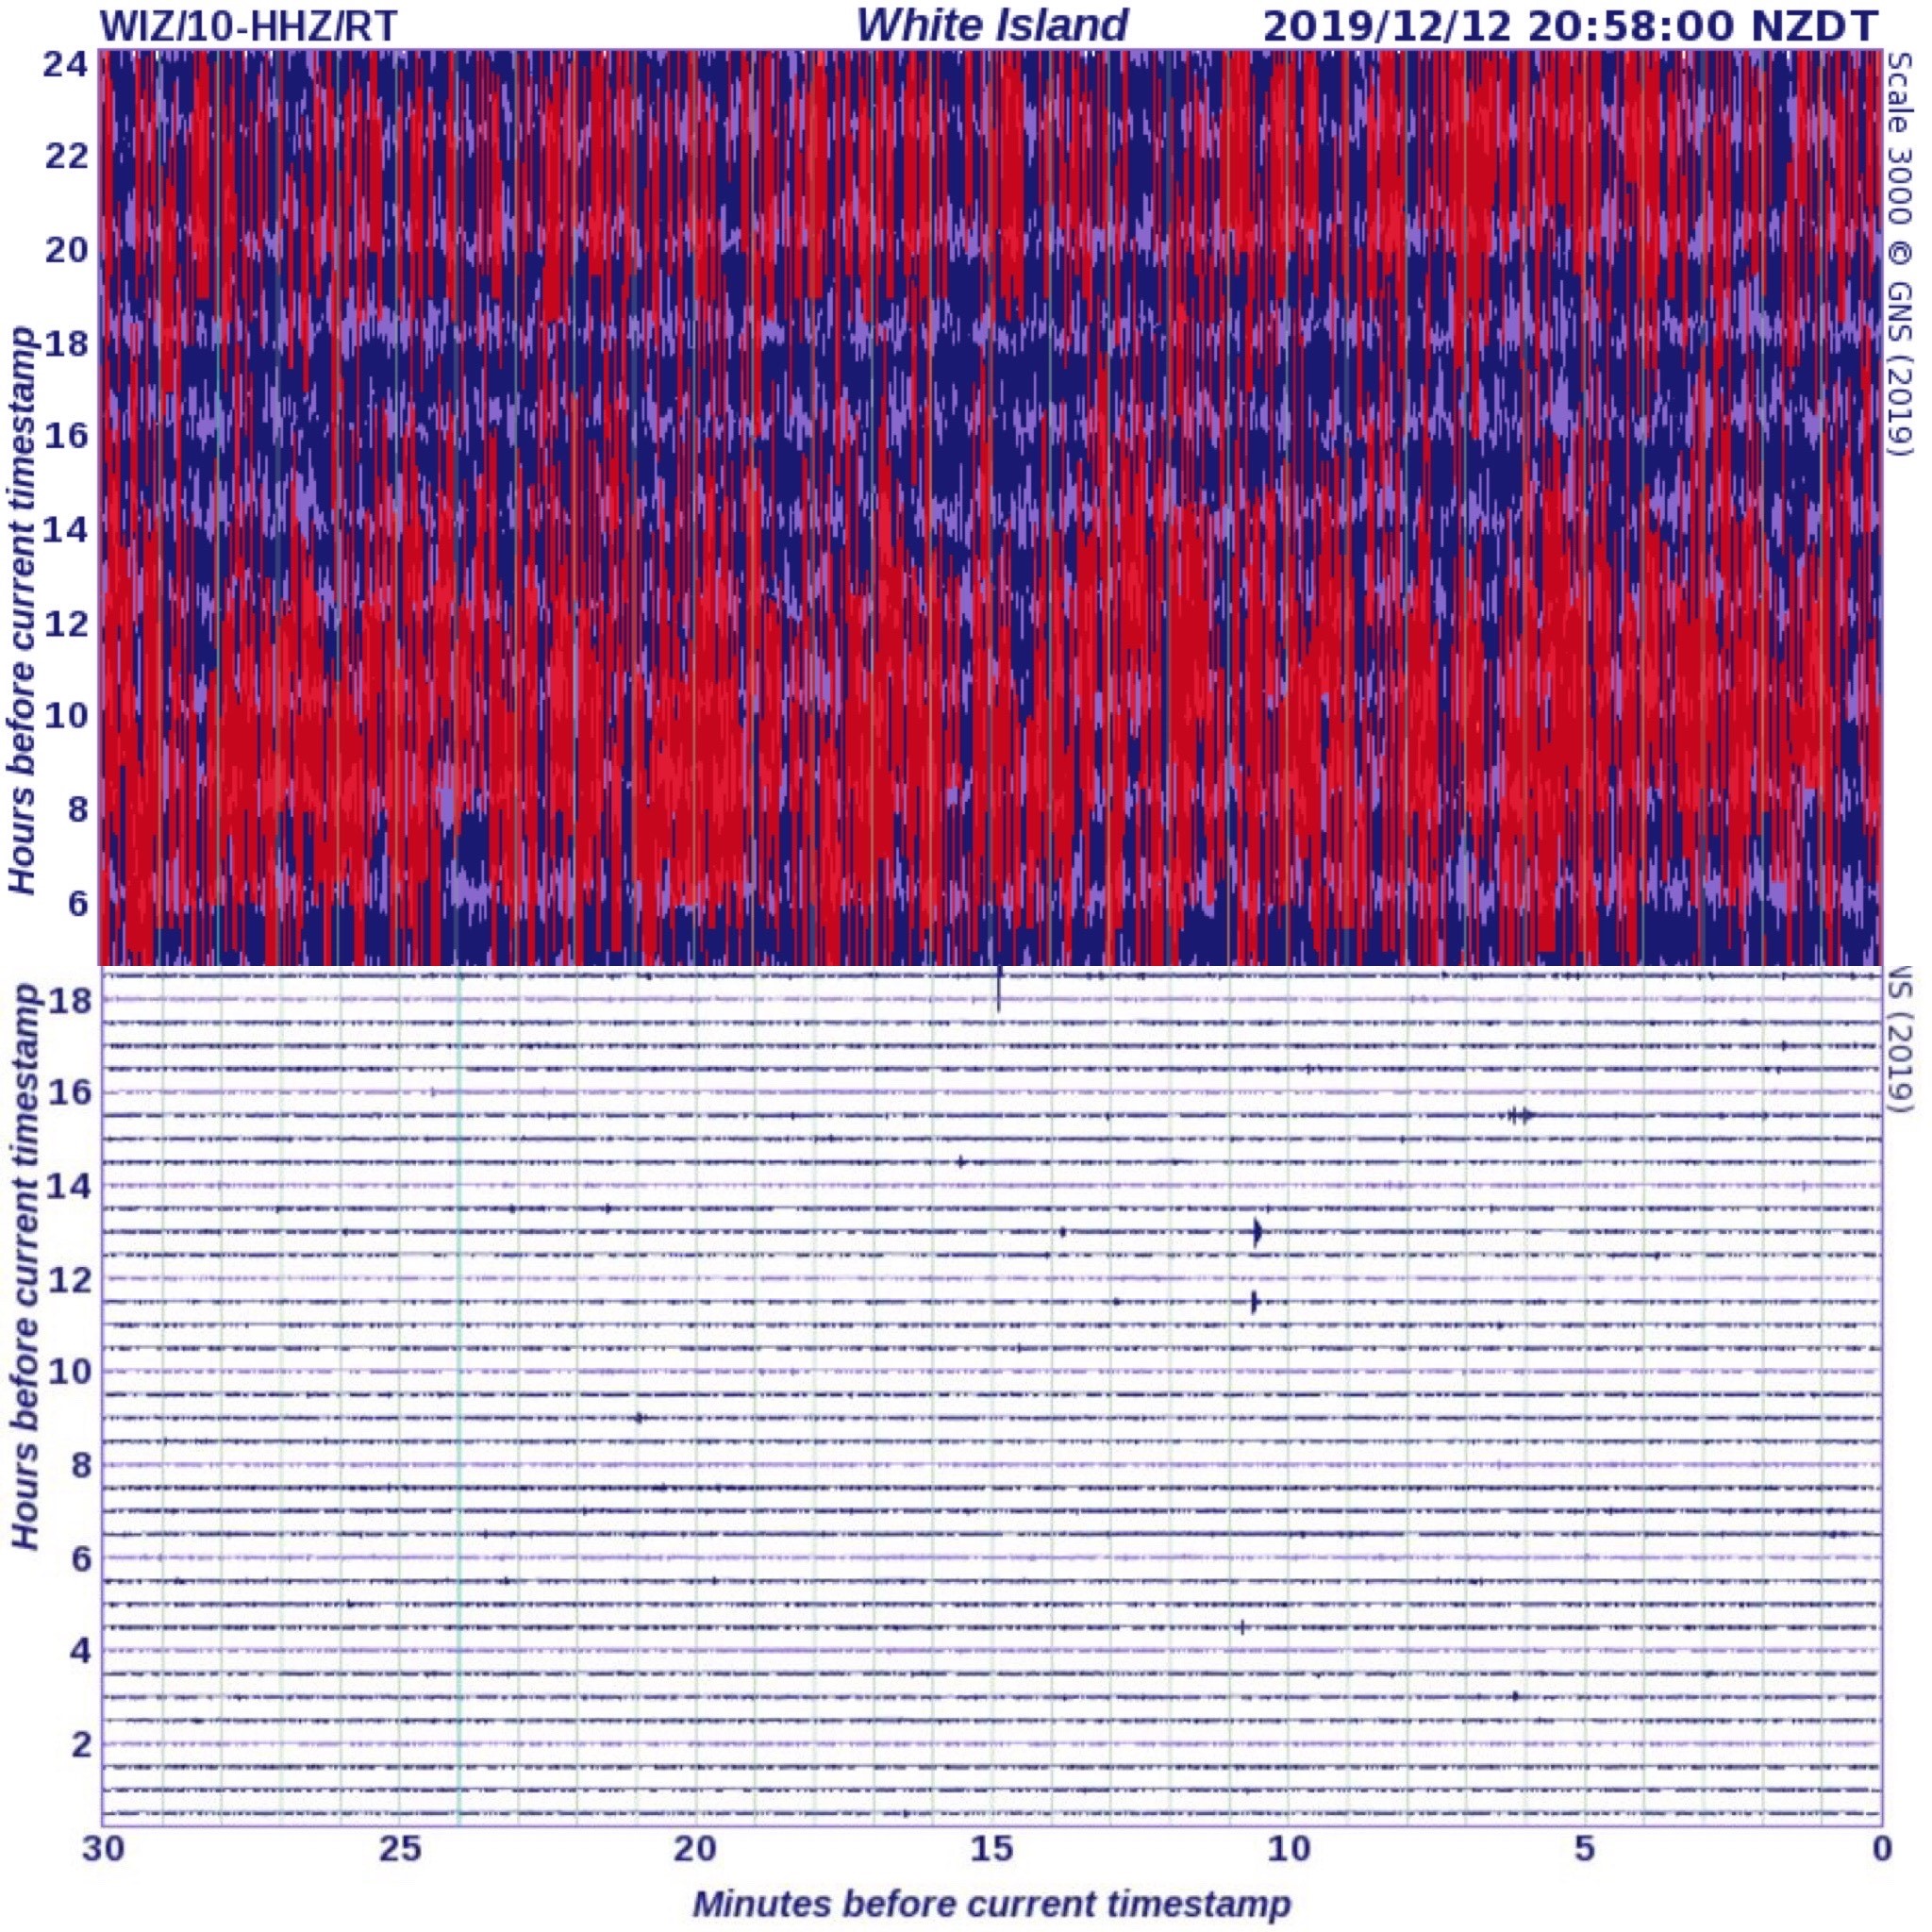
Website White Island drum plot
Need to Talk? If you would like support or advice, have feelings of anxiety, stress, prolonged fear, hopelessness or anger, or if you just need to talk with someone. Please text or phone 1737 to speak to a trained councillor in the National Telehealth Service. Its free to call or text.