Digging into new data from Te Wai ā-moe, Ruapehu
Welcome, haere mai to another GeoNet Data Blog. Today’s blog is about some new data we recently started collecting at Te Wai ā-moe, Ruapehu Crater Lake.
Lake-temperature data
Lake-temperature is the most important dataset from Te Wai ā-moe, because it is a direct reflection of how much heat enters the lake from the volcanic vents below.
While the old site is still in place, we are measuring temperature with three sensors. The main one is a thermocouple that is tough enough to be immersed in the hot, acidic lake water for many years without corroding and failing. We also have a temperature feed from one of the lake-height sensors. The old lake-temperature sensor, which is actually a LM35, a temperature sensitive Integrated Circuit, is still present and providing data.
In the Tilde Data Discovery GUI, you can see all the latest temperature data by selecting “envirosensor” as the Domain, “lake-temperature” as the Name, and “RU001” as the Station. It is recommended to also select “snapshot” as the Method and leave SensorCode and Aspect on their default values of “All”. For the Data Period, select “Latest Data” and chose the time window you want.
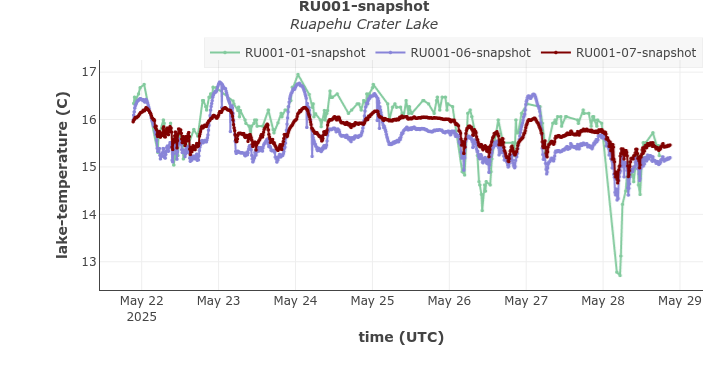
An example of lake-temperature data from the new and existing sensors at Te Wai ā-moe. The data from the old sensor is shown in green, and the two new sensors in blue and maroon. The graph is generated using the Tilde Data Discovery GUI.
All the sensors are relatively close to the lake shore and in relatively shallow water so the recorded temperature regularly varies between day and night (a diurnal temperature variation). You can see that for May 22, 23, 24, and 25, remembering that we time our data in UTC, so 0000 UTC is 12 noon, or 1 pm during daylight saving time. At times, May 28 is a good example, heavy rain falls on the lake and cools the near-surface water causing our temperature record to drop. Installing sensors deep in the lake would be ideal, but it is impractical.
Lake-height data
We measure lake-height data because how much water there is in the lake affects how much lake temperature changes for a given amount of heat. Think of a large pan of cold water on your stovetop that takes longer to heat than a small pan.
The primary lake-height sensor recently installed is referred to as a “bubbler”. The sensor itself isn’t immersed in the water but sits beside the lake and measures the pressure it takes to create a continuous airflow through a tube submerged in lake. From pressure we calculate the water-height. We use the same technology at Inferno Crater, Waimangu.
The second new lake-height sensor is immersed in the water, and also provides one of the temperature datasets.
The two new lake-height sensors (or the end of the tube for the bubbler) were about 1.4 m below the lake surface when installed. Data from the old lake-height sensor are still available and that sensor is about 1.9 m below the lake surface.
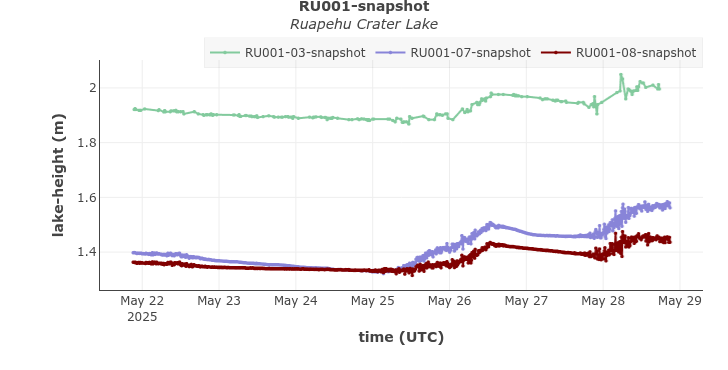
Lake-height data from the new and existing sensors at Te Wai ā-moe. The old lake-height sensor (green) shows it is about 1.9 m below the water surface and the new sensors (blue and maroon) about 1.4 m. Graph generated using the Tilde Data Discovery GUI.
Under normal circumstances, when effects caused by volcanic activity are either minor or relatively slow, rainfall produces relatively rapid rises in lake-height followed by slower declines as the lake overflows and additional water from rain leaves the lake.
MultiGas data
MultiGas is a convenient name for a system with three sensors that we use to measure the concentration of volcanic gases in the air. It is a relatively new development at GeoNet, and the data from Te Wai ā-moe looks like it will be the most exciting so far. We have sensors for carbon dioxide (CO2), hydrogen sulphide (H2S) and sulphur dioxide (SO2). The sophisticated CO2 sensor sucks in air and senses the CO2 concentration by measuring how much infrared light is absorbed by the gas. The H2S and SO2 sensors are a lot simpler and use an electro-chemical reaction on their surface to estimate the gas concentration. The idea is to calculate the ratios CO2/SO2 and H2S/SO2, and use that to boost the power of our scanDOAS SO2 monitoring technolog
Normally, the atmosphere in New Zealand contains about 420 ppm (parts per million) CO2, measured at Baring Head, near Wellington. So, our CO2 sensor always measures gas, whereas H2S and SO2 concentrations are close to zero, unless you are measuring at an active volcano like Ruapehu.
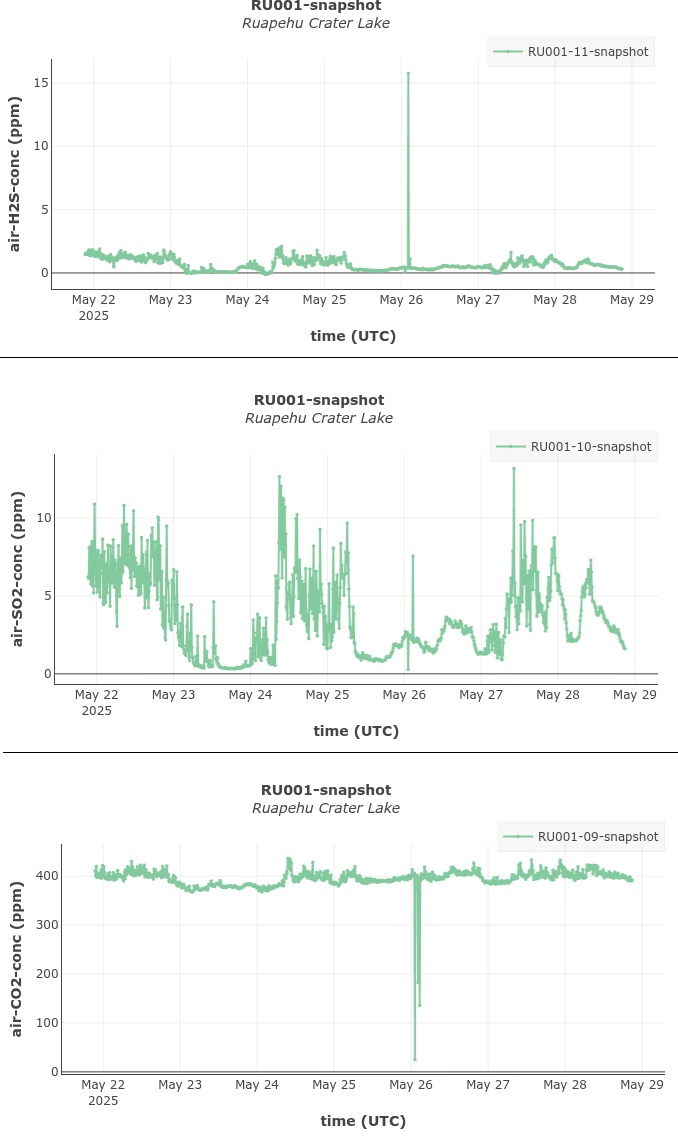
An example of air-H2S-conc (top), air-SO2-conc (middle), and air-CO2-conc (bottom) from the new system at Te Wai ā-moe. Spikes in the data early on May 26 are calibration signals. Graphs generated using the Tilde Data Discovery GUI.
The MultiGas sensors, especially the electro-chemical H2S and SO2 ones, come in direct contact with the air, which, when gas concentrations are high, can be corrosive. We need to know if this causes changes in the sensitivity of the sensors over time. If that happens, the ratios CO2/SO2 and H2S/SO2 will be incorrect, and the Volcano Monitoring Groups’ interpretation of volcanic gas emission data will be off. To try to overcome this, we have built a sophisticated, automatic calibration capability into the MultiGas system. We have canisters of CO2, H2S, and SO2 of known concentrations as part of the system. Once a week, these gases are automatically sent to the sensors, and we can compare what concentration the sensor records with the known concentration from the canister. We can also simulate no gas to check if sensors correctly measure zero concentration. This way we can make a corrected version of the data and use that to calculate gas ratios with more confidence. If you look at the graphs of gas concentration you’ll see spikes in the data early on May 26, those are the calibration signals.
Other MultiGas stations, on Ngauruhoe and Tongariro, have so far not measured any H2S or SO2, but the Ruapehu site is measuring those gases and once we have several calibrations, we’ll be able to apply those and start to calculate gas ratios.
Weather data
We measure air-temperature at the site. Not that it has any relationship to volcanic activity, but because the lake-temperature fluctuates between day and night and air-temperature helps us understand that.
We are also measuring wind speed and direction as it helps understand the MultiGas data better. For example, is a lot of gas measured just because the wind is blowing the gas towards the sensor? The wind sensors don’t have moving parts as winter snow and ice will damage those sensors, instead we use an ultrasonic anemometer as they are more robust. Although our experience elsewhere is that when covered by snow or ice, which top of Ruapehu gets lots of in winter, they don’t give useful data, but when the snow and ice melts they work fine. They are the best solution to a difficult measurement problem.
Wrapping up the sensors
Between them, the old and new data loggers at Te Wai ā-moe are producing a lot of data streams. This table is a handy summary. If you need more detail, it’s all in our Delta metadata database.
| SensorCode | Name (thing measured) | Sensor type | Comments |
|---|---|---|---|
| 01 | lake-temperature | integrated circuit | old data stream |
| 03 | lake-height | immersed | old data stream |
| 05 | lake-temperature lake height | immersed | new data stream |
| 06 | lake-temperature | thermocouple | new data stream |
| 08 | lake-height | bubbler | new data stream |
| 09 | air-CO2-concentration | infrared-red spectroscope | new data stream | 10 | air-SO2-concentration | electro-chemical | new data stream | 11 | air-H2S-concentration | electro-chemical | new data stream | 12 | wind-speed wind-direction | ultrasonic anemometer | new data stream |
You might wonder what SensorCode means. Think of it as a number that indicates where a particular sensor is plugged into a data logger. The numbers have no influence of the data themselves, but they help us more easily keep track of different sensors. In case you are wondering, sensorCodes 02 and 04 were used for sensors that no longer exist.
Updated data - how often?
As the new data streams are part of our environmental data collection system, new values are recorded every 10 minutes, and automatically collected by our data centre once an hour. You can see updated data just before the hour, each and every hour through the Tilde Data Discovery GUI and elsewhere for geeks.
The old data streams are a different story. Those data are collected every 15 minutes, uploaded to a satellite several times a day then sent to a data centre in France. But because of the way the communication between the data logger and satellite works, not all data make it to the satellite and sometimes the data we receive has errors. We automatically download recent data from the data centre every morning, but because of the possible errors we need to do a manual check before we can ingest in Tilde. So, the old data streams, lake-temperature and lake-height, make it to Tilde only about three times a week.
So far data from the new sensors are looking good, we aren’t seeing significant data gaps. Pretty soon we’ll stop the manual checking of data from the old sensors and ingesting them in Tilde, which was our goal all along. The plan is to remove all the old equipment next summer, but in the meantime, we can restart manual Tilde ingestion if our new system has any teething troubles.
That’s it for now
New stuff is exciting. The new data streams coming from Te Wai ā-moe are a mix of modern, reliable replacements for old sensors just hanging on to life, and new technology that offers benefits we’ve never had before. If the Te Wai ā-moe data interest you, we suggest keeping track of the Ruapehu Volcanic Activity Bulletins through the News section on the GeoNet website as that is probably the first place you’ll hear about the data being used. Alternatively, follow the guidelines here and jump into Tilde.
You can find our earlier blog posts through the News section on our web page, just select the Data Blog filter before hitting the Search button. We welcome your feedback on our data blogs and if there are any GeoNet data topics you’d like us to talk about please let us know!
Ngā mihi nui.
Contact: info@geonet.org.nz