Our First GeoNet Data Blog - Making the Most of Volcanic Alert Level Data
Welcome, haere mai to our first GeoNet Data Blog post! This is a new initiative with a focus on GeoNet data-related stories. In some blogs, we plan to talk about specific data sets, and in others more general data information. We’ll try not to make the blogs too technical, but we will sometimes include some computer code to help some readers work with the data sets.
We start this new GeoNet adventure with a look at Volcanic Alert Levels; What is GeoNet’s Volcanic Alert Level (VAL) data set and how can you access it? How do we visualize when VAL changes? How can we find out how long a volcano has been at a particular VAL? GeoNet only made this data set available recently, and it’s topical with the recent unrest at Ruapehu volcano.
Let’s get into it.
VAL as a dataset
Aotearoa-New Zealand uses a numeric Volcanic Alert Level (VAL) system to help convey a summary of what’s happening at our active volcanoes. VALs are set by the Volcano Monitoring Group (VMG) at GNS Science. You can find description of the VAL system, and the current alert levels on the GeoNet website.
Keep those two acronyms (VMG and VAL) in mind: we will use them quite a lot through this post.
GeoNet hosts the complete record of VALs on a public GitHub repository as CSV (comma-separated value) files. The GitHub repository has VAL data for 12 volcanoes. What do the data look like? Here is the header and last three rows from the file VAL_Ruapehu.csv.
PeriodStart UTC,PeriodEnd UTC,VAL,VAL System Version,Description,PeriodStart LocalTime,PeriodEnd LocalTime
2020-12-20T23:15:00Z,2021-01-11T01:14:59Z,2,3,Moderate to heightened unrest,2020-12-21 12:15:00 NZDT,2021-01-11 14:14:59 NZDT
2021-01-11T01:15:00Z,2022-03-21T00:44:59Z,1,3,Minor unrest,2021-01-11 14:15:00 NZDT,2022-03-21 13:44:59 NZDT
2022-03-21T00:45:00Z,9999-01-01T00:00:00Z,2,3,Moderate to heightened unrest,2022-03-21 13:45:00 NZDT,9999-01-01 00:00:00 NZST
As you can see, there is a specific format to the CSV files, making them easy to read in pretty much any data processing or visualization tool. As well as VAL values and a short description of what they mean, we provide the start and end dates-times of those values, and the VAL system version. Although we have one VAL system, it’s on its third version and isn’t directly comparable across versions. The other peculiarity to note is that we provide the start and end dates-times in both Universal Time (UTC) and NZ Local Time; this is to cater for both scientific and general users.
Plotting a step function
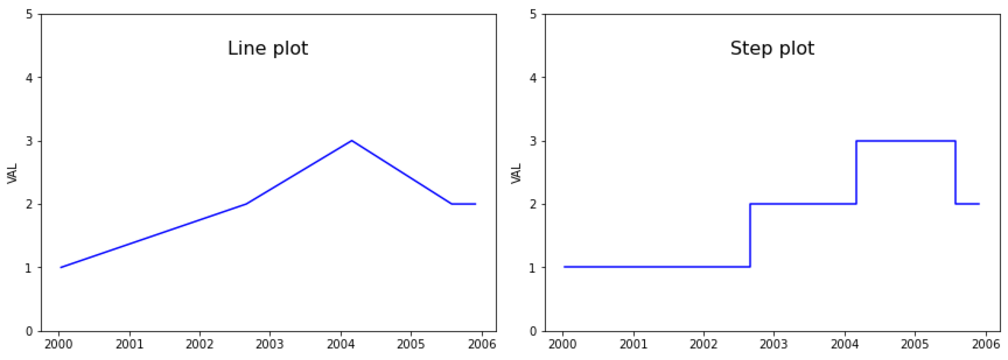
The VMG votes on what the VAL should be, typically weekly for active volcanoes such as Ruapehu and Whakaari, and when required for less active volcanoes. When the VMG changes a VAL, it stays at that value until it’s changed to a different value. The VAL data set records only VAL changes, not times when the vote was to keep the VAL unchanged. While a table of VAL data has all the information, it’s not easy to find the parts we need, but representing the data graphically can help with that. We need some kind of plot with time on the x-axis and VAL value on the y-axis. A regular line plot isn’t suitable as it doesn’t convey that the VAL remains at its current value until changed. My preference is a step plot, which you can think of as stairs that go up and down at irregular intervals. Using some simplified, artificial data; I hope you can see that a step plot is a good way to go.
PeriodStart, VAL
2000-01-15, 1
2002-09-01, 2
2004-03-01, 3
2005-08-01, 4
2005-12-01, 2
Line step montage
Let’s apply the step plot to real Ruapehu VAL data, with a couple of extras to make it more user-friendly. I did this using the python programming language with the pandas data analysis library.
I read the data file directly from the GitHub repository to ensure I get the most up to date data, but downloading the file and reading that works too.
import pandas as pd
import matplotlib.pyplot as plt
import datetime as dt

valfile = 'https://raw.githubusercontent.com/GeoNet/data/main/volcanic-alert-levels/VAL_Ruapehu.csv'
val = pd.read_csv(valfile)
I’m using only the VAL data from when the VAL system was version 3, recalling that the values are not backwards compatible to previous system versions.
ver3 = val[val['VAL System Version'] == 3]
PeriodEnd for the final row in the CSV file is set to 9999-01-01, as it’s open ended. We want to work with datetime values in python as this makes visualization and some other tasks easier, but 9999-01-01 isn’t a valid datetime in pandas. We set this to the current date and time.
nowutc = dt.datetime.now(dt.timezone.utc).strftime('%Y-%m-%dT%H:%M:%SZ')
nownzst = dt.datetime.now().strftime('%Y-%m-%d %H:%M:%S NZST')
ver3.replace(['9999-01-01T00:00:00Z', '9999-01-01 00:00:00 NZST'], [nowutc, nownzst], inplace=True)
And convert the dates and times to datetime values.
ver3[['PeriodStart UTC','PeriodEnd UTC']] = ver3[['PeriodStart UTC','PeriodEnd UTC']].apply(lambda x: pd.to_datetime(x,infer_datetime_format=True))
ver3[['PeriodStart LocalTime','PeriodEnd LocalTime']] = ver3[['PeriodStart LocalTime','PeriodEnd LocalTime']].apply(lambda x: pd.to_datetime(x,infer_datetime_format=True))
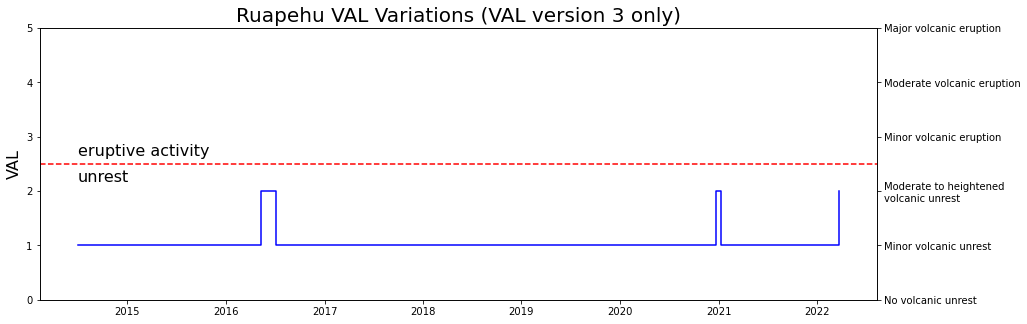
A default plot will auto-scale the y-axis which will be a little misleading, so we'll specifically set the y-axis limits and labels to 0-5. We’ll include a dashed line which shows the distinction between volcanic unrest and eruptive activity; this is at the change from VAL 2 to VAL 3. Finally, we’ll add the VAL description for each level to the right-hand axis, useful for those not so familiar with what each number means.
fig,ax = plt.subplots(figsize=(15,5))
color='blue'

#plot the VAL
ax.step(ver3['PeriodStart UTC'], ver3['VAL'], where='post', color=color)

#title and y-axis label
ax.set_title('Ruapehu VAL Variations (VAL version 3 only)', fontsize=20)
ax.set_ylabel('VAL', fontsize=16)

#y-axis limits to 0-5
ax.set_ylim(0,5)

#y-axis labels ordinal 0-5
ax.set_yticks(list(range(0,6)))

#transition between unrest and eruptive activity
ax.axhline(2.5, linestyle='--', color='red')
ax.text(dt.datetime(2014,7,1), 2.4, 'unrest', fontsize=16, va='top')
ax.text(dt.datetime(2014,7,1), 2.6, 'eruptive activity', fontsize=16, va='bottom')

#description of VAL on the right y-axis
ax1 = ax.twinx()
description = ['No volcanic unrest', 'Minor volcanic unrest', 'Moderate to heightened\nvolcanic unrest',
               'Minor volcanic eruption', 'Moderate volcanic eruption', 'Major volcanic eruption']
ax1.set_yticklabels(description);

plt.savefig('ruapehu_val_plot.png', facecolor='white', bbox_inches='tight')
We see that Ruapehu has only been at VAL 1 and VAL 2 since 2014; there has been no eruptive activity. The small spike up to VAL 2 at the right is the response to the recent heightened unrest.
Ruapehu VAL plot
How long has Ruapehu been at VAL 2?
Following a recent Volcanic Activity Bulletin, GeoNet’s Volcano Duty Officer was asked by a media organisation about how long Ruapehu had been at VAL 2 in the recent years. I decided I’d have a go at working that out – it’s actually quite simple. Here we take advantage of having the start and end times of each VAL period as a python datetime. We create a column in our data frame that contains the duration of each period of VAL, and format that as the number of days. Then we group the durations according to the VAL and sum them.
ver3['duration'] = (ver3['PeriodEnd UTC'] - ver3['PeriodStart UTC']).astype('timedelta64[D]')
What I found is that Ruapehu has been at VAL 1 for 2743 days, and VAL 2 for 134 days; that’s less than 5% of the time at VAL 2, moderate to heightened volcanic unrest. I did that calculation on 20 May 2022; if you do it, you’ll obviously get a slightly different result.
There are other things you could do with the VAL data set, such as comparing VAL with some of GeoNet’s volcano monitoring data. If we have a sustained period of eruptive activity from one of our volcanoes, it would be valuable to compare the response actions of various agencies to VAL changes. This might deliver insights into how those agencies might have incorporated VAL into their risk reduction procedures.
That’s it for our first data blog!
We welcome your feedback, and if there are any GeoNet data topics you’d really like us to talk about, please let us know.
Contact: info@geonet.org.nz