Tsunami DART Data and Access Using TILDE - Our Low-Rate Time Series Application
Welcome, haere mai to another GeoNet Data Blog. Today we will be diving into the Pacific Ocean to get a better understanding of our tsunami monitoring system, which for the majority of the time is relaxing on the waves and monitoring for any changes in water level.
It is only during large events, such as the Hunga Tonga-Hunga Ha’apai Eruption on the 15th of January 2022 that they get a lot of attention. So, what is the DART network and how does it help detect and monitor tsunami? That is what we are going to cover today as well as showing you how to find the data so you can check on the DARTs yourself.
What is DART?
DART stands for the Deep-ocean Assessment and Reporting of Tsunami and consists of two main pieces of equipment, a bottom pressure recorder (BPR) and a surface buoy (effectively a floating radio). The BPR is anchored to the sea floor and constantly measures the water pressure and the temperature, saving a data point every 15 seconds. The water pressure is later converted to a water depth, which we can use to estimate sea surface wave heights. This data is relayed via an acoustic modem (that generates sound waves) to the surface buoy by transmitting the data through the water column. Once the data has reached the buoy it is then transmitted via satellite to monitoring centres such as the NGMC (National Geohazard Monitoring Centre) at GNS Science.
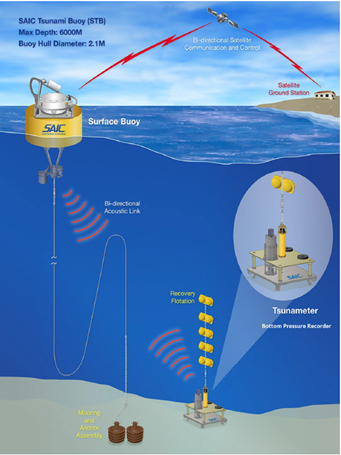
DART System overview, with the surface buoy on the left and the BPR on the right.
During normal monitoring, when the BPR hasn’t sensed a tsunami wave, a packet of data is sent from sea to land every 6-hours. This data packet consists of a series of observations of sea-level height at 15-minute intervals. When a tsunami wave travels over the BPR, this change in water pressure is detected and the affected DART system automatically enters a triggered state which also alerts our NGMC. The triggered DART system begins to send higher rate data (15-second data) much more frequently, for up to the next three hours, or until the water pressure returns to normal.
As our communication with the surface buoy is two-way, Geohazard Analysts (GHA’s) in the NGMC can also remotely (manually) trigger a DART. This allows us to trigger DARTs nearby the one that has been automatically triggered and start to immediately receive the high-rate data from several DARTs without waiting for them to be triggered automatically by the travelling tsunami wave. This allows our NGMC to get a better understanding of how the tsunami waves are propagating across the ocean, and to pass that information to our tsunami experts for evaluation if they are activated in a response. For more details on how the DART network is used in a response, see the GeoNet DART page here.
Viewing and accessing this data
Previously this data has only been available by those who have requested access, but now with GeoNet’s new application programming interface (API) for low-rate time series data (Tilde), the DART data is now accessible to everyone. Tilde is documented here, but we will repeat some of the key information and provide some examples to better explain how to use it with DART data.
Through Tilde we also provide a visualisation tool for Data Discovery. This is often a good place to start as this web page provides visualisation and data download in one application. It also shows the detail of your API request for those who want to learn how to make data requests without using the Data Discovery tool.
The API requests are structured by a data domain, the name of the type of data you want, the station, the data method, and the sensor code. This is further explained in the table below.
| Function | Parameters | Description |
|---|---|---|
| Domain | dart | This is the dataset that is being accessed |
| Name | water-height, or water-height-detided |
The “water height detided” is calculated by applying tidal constituents to the water height values, the aim of this is to remove the tidal signal |
| Station | NZA, NZB, ...etc | Each DART is known by a 3-letter code |
| Method | 15m, 15s, raw | 15-minute samples, 15-second samples, or raw data which is collected when we retrieve the BPR (15-second samples) |
| Sensor code | 40, 41, or 42 | If a DART is replaced, then it’s sensor code changes, first 40, then 41, etc. This is also called the “deployment number”. |
| Aspect | nil | Does not apply to the DART data |
As a data user, you first need to decide if you want “water-height” or “water-height-detided”. The detided data has had water height variations due to the tides removed which makes any abnormal signals, such as tsunami, more obvious. The detided data is generated by applying tidal constituents to the water height data. The tidal constituents are generated by NIWA based on data collected for each DART. We’ll go into a bit more detail about how we “de-tide” data in an upcoming blog.
An example using the 15 January 2022 Hunga Tonga-Hunga Ha’apai eruption tsunami
To give you an idea of what DART data looks like when provided by the Tilde Data Discovery GUI, we are going to show a few different examples of ‘water height’ and ‘water height detided’ plots for the tsunami signal arriving at NZF following the Hunga Tonga-Hunga Ha’apai eruption on the 15th of January 2022.
During the response, the TEP and the NGMC had access to the 15 second (15s) and 15 minute (15m) data to visualise what the tsunami signal looked like. This would look like the following two plots, for water-height and water-height-detided.
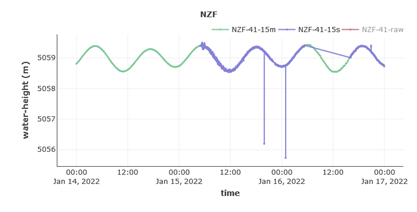
The 15 second (purple) and 15 minute (green) water-height data showing the tsunami signal arriving at station NZF. This shows how the tsunami signal can appear slightly hidden among the tidal signal.
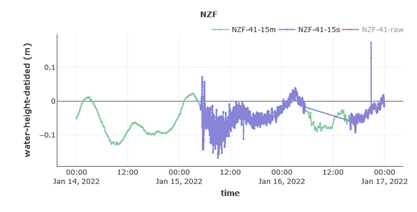
The 15 second (purple) and 15 minute (green) water-height-detided data showing the tsunami signal arriving at station NZF. Without the tidal signal we can see the tsunami signal more clearly.
In the water-height-detided plot we can see that the tsunami signal is much clearer. We can also see the gaps in the 15 second triggered data. These gaps occur because the 15 second data only arrives when the DART has been triggered (either automatically or manually) and last for 3 hours. From the beginning of the tsunami signal on the 15th of January until early morning on the 16th, we can see that we have a nearly continuous stream of 15 second data as the DART was being manually triggered repeatedly by the NGMC. This was then broken by a period of quiet before being manually triggered again later in the day on the 16th as NZG, one of the nearby DARTs, had an automatic trigger.
What’s the “raw” data?
The ‘raw’ data is the data which is collected off the BPR once it has been picked up from the sea floor. This ‘raw’ record typically contains 2 years of continuous data at a 15-second sample rate, and it can be particularly useful to see a higher rate of sampling continuously and not just when there was trigger. This data is uploaded to Tilde once it has had some quality checks applied to make sure that it matches to the already existing 15-minute data, as these two should be exactly the same but just differ by sampling period. To find out when each BPR was deployed and collected please refer to Delta, our sensor network record. This file also contains the deployment numbers under the Location code, which can then be paired with the Sensor code within Tilde’s Data Discovery GUI.
Continuing to use the example of the Hunga Tonga-Hunga Ha’apai eruption tsunami on the 15th of January 2022, the two plots below, for water-height and water-height-detided, show how valuable the BPR data is, and how it allows us to fill in the gaps giving researchers to get a better understanding on what happened during the event.
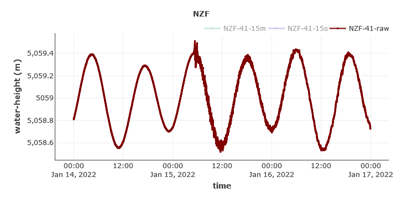
The raw (collected from the BPR), 15 second water-height data showing the tsunami signal arriving. This shows how the tsunami signal can appear slightly hidden among the tidal signal.
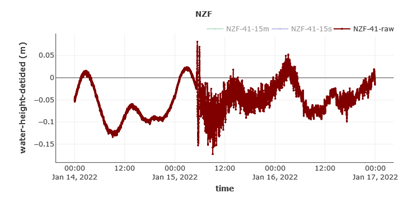
The raw (collected from the BPR), 15 second water-height-detided data showing the tsunami signal arriving. Without the tidal signal we can see the tsunami signal more clearly.
As the raw (BPR) data is not collected during a response, it is often not for quite a few months or even years later that the above data is seen. In this case, as NZF was scheduled to be serviced in the July-August 2022 voyage, the high rate BPR data was retrieved around 7 months after the event.
Data Tutorials
We also provide data tutorials on accessing and using DART data without using the Data Discovery GUI, but with direct API calls. We’ll cover those in another blog.
That’s it for now
The DART network is continually improving and there are always more details that can be discussed but for now, we will leave you with a quick 2 minute video showing the DART technology in action.
You can find our earlier blog posts through the News tab on our web page, just select the Data Blog filter before hitting the Search button.
We welcome your feedback, and if there are any GeoNet data topics you’d really like us to talk about, please let us know!
Contact: info@geonet.org.nz