How Often Do You Collect Data?
Welcome, haere mai to another GeoNet Data Blog. Today we delve into data collection rates. How often we collect different types of data, why they are different, and what it means to you as a data user.
GeoNet collects data, lots of it. In 2022, we collected about 20 TB (terabytes) of new data. That is enough data to hold about 1 billion pages of text as word processor files, or about 13 months of continuous HD video! What makes GeoNet’s data interesting, and also sometimes a bit complicated to manage, is that we collect many different kinds of data. Think seismic, webcam images, tsunami waveforms, etc. What is probably less well known is that we collect data at vastly different rates.
Data recording and data collection
Before deep diving into rates, we should introduce two concepts that will be used in this blog. Data recording and data collection.
Data are “recorded” at various locations all around Aotearoa (by a digital sensor or by someone taking the measurement). These data then need to be transported and “collected” at the GeoNet Data Centre, where some process will be used to curate and archive them.
Data recording rates, what do we mean and why are they different
By data recording (or sampling) rate we mean how frequently we record data observations.
Geohazards occur over a wide range of spatial and time scales, so we need to record data at different rates to be able to properly capture data on all the hazards we monitor.
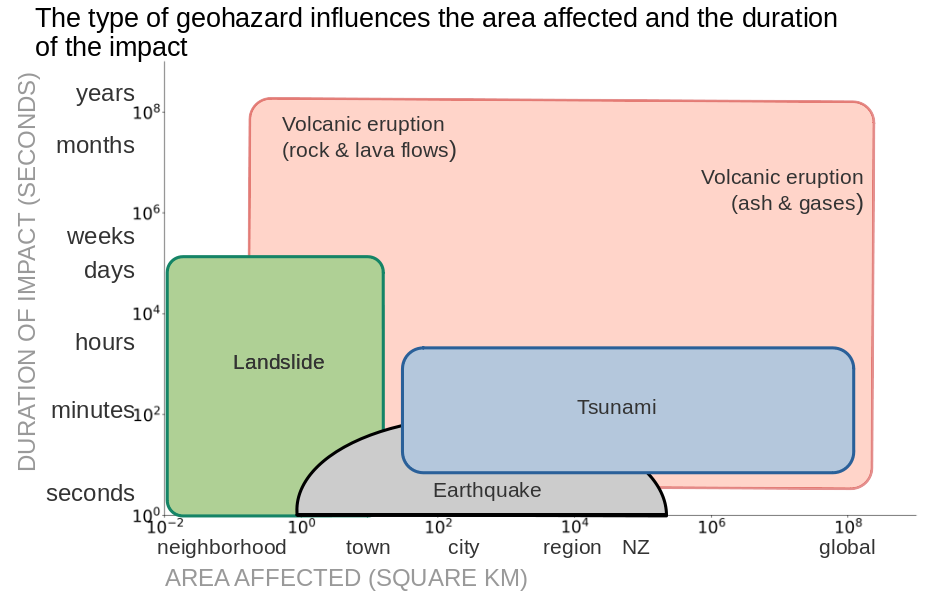
Geohazards can occur at a range of time scales and affect small to large areas. The range of times scales directly affects the data recording rates we need to have. Modified from an original by Gill and Malamud.
So, when we record data to support the understanding of these geohazards, it’s with the goal of describing how the features of the thing we are measuring change with time. We need to record data often enough to show how those features change, but not too often that the data volumes become unnecessarily large and unmanageable for our systems. Here’s an example of what we mean.
Consider all the different reasons you might have to measure the height of the sea in a harbour:
To measure climate induced sea level rise we might need just a few measurements a year as the rate of rise is relatively slow.
To measure tides, which have two highs and two lows every day, every few minutes is a common measurement rate.
To observe tsunami, something GeoNet actually does, we measure height once a second and once every 10 seconds.
So, decisions on what data recording rate to use depend on how quickly the thing you are measuring varies, and what you want to do with the data. Some of the things we measure vary more quickly than others, so different things are measured at different rates.
Here are some (non-exhaustive) GeoNet examples:
An earthquake can shake the ground back and forth up to several tens of times a second. We need that shaking information to understand how the earthquake unfolds and its impact on buildings and other structures. To do that we make observations of ground shaking 100 or 200 times every second. We call that a data recording rate of 100 or 200 samples per second (sps), sometimes referred to as 100 or 200 hertz (Hz).
In the tsunami gauge example we used earlier, data are recorded at a maximum rate of once a second, 1 sps (or 1 Hz), as we need to record the shape of the tsunami waves in enough detail that they can be modeled by our experts, and we can eliminate the effects of variations caused by wind on the water surface and passing boats.
We measure permanent or semi-permanent ground movement (deformation) with GNSS instruments. The GNSS data are recorded at three rates: 1 and 10 sps (or 1 and 10 Hz), and one sample every 30 seconds. These rates allows us to see very short-term changes in the ground position, and also allow us to derive very precisely the change in position from one day to another and generate daily time-series, that are used for long-term deformation studies.
Automatic environmental measurements:
◦ Volcanic lakes and hot springs can vary in temperature and water level. We know that it takes hours or days to get a noticeable increase in the temperature of a volcanic lake or hot spring, so we don’t need an observation every second. A measurement rate of once every 10 minutes is more than sufficient, and a similar rate is appropriate for measuring the sulphur dioxide gas (SO2) being emitted by our volcanoes.
◦ A similar argument is used for measuring soil moisture in areas subject to potential landslides. As the moisture level depends on water percolating down from the surface it cannot vary very quickly and recording observations once every 10 minutes is sufficient to track that variation.
To record an important subset of volcano monitoring data someone has to actually go to a volcano with a measurement instrument or sample collecting kit. The highest rate at which this is typically done is about monthly, though for some locations and types of data is only once a year. This is a situation where the data recording rate isn’t sufficient to adequately track changes in features being regularly observed.
That’s a lot of words, here’s the same information as a diagram that should be a bit easier to get your head around.
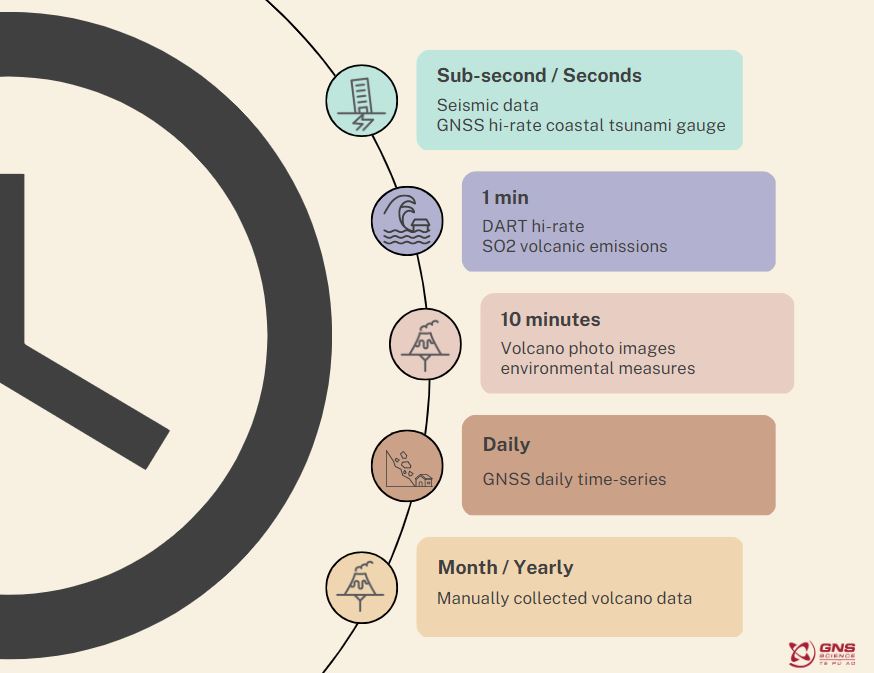
Illustrating the different rates at which GeoNet records data. The highest rate is for seismic data at 100 or 200 samples per second. The lowest rate is manually recorded volcano data recorded only once a year.
What different data rates mean for our data users
By recording data at different rates, we are directly affecting the volume of data we create. Data recorded at a higher rate will typically have a larger volume (more megabytes) than data recorded at a lower rate. These data need to be transported using different transport mechanism (such as satellite, cellular and so on) and then collected by a data centre. At GeoNet, data collection rates might vary depending on what type of data we are collecting and how “urgently” we need to use, analyse and distribute these.
If we think again about the examples above:
Data that have recorded an earthquake (or a tsunami) need to be quickly collected and analysed. For these, the data collection mechanism is something that we call “real time”. As soon as data are recorded by a sensor, they are transported and collected at our data centre.
Data that are used to monitor the ground deformation can be collected more “slowly”. We record data from our GNSS stations every 30 seconds, but we only need them once per day. So, to optimize the capacity of our transport network, we bundle all 30 seconds data into a data packet that is 1 hour long, and transport and collect this once every hour. This is because the main purpose is to produce a daily time series, so we don’t need to collect data in real time.
Data that are used to monitor volcanoes and landslides are automatically recorded by a sensor once every 10 minutes but are collected only once an hour, as we don’t need to analyse the data so often.
Lastly, data that are manually recorded can take some time before they are collected by the GeoNet data centre. After someone went to a volcano to do the measurement, this person will need to go back in the office, analyse the measurement in their office or in a laboratory, and then send the results to the GeoNet data centre. This can take days or sometime weeks.
| Data Type | Data recording rate | Data collection rate |
|---|---|---|
| Seismic | 100 or 200 per second | Real time |
| Raw GNSS | 2 every minute | Once per hour |
| Photo images | 1 every 10 minutes | Real time |
| DART (ocean tsunami gauge) | Once every 15 minutes (if there is no tsunami) Once every 15 seconds (if there is a tsunami) |
Every 6 hours (if there is no tsunami) Real time (if there is a tsunami) |
| Scan DOAS (volcanic sulphur dioxide, SO2, emissions) | Once every 4 to 6 minutes | Once a day |
| Environmental sensors | Once every 10 minutes | Once per hour |
| Manually collected volcano data | Monthly/yearly | After initial analysis is completed |
.
How to use it?
So, what is the impact of all of this on the users of GeoNet data? In a nutshell, we don’t make all our data available right away. We try to balance our data collection mechanisms so that the data transportation is manageable, and the transport infrastructure does not get overwhelmed by all the different data that we record. As a result, we need different data delivery applications for different data types, and data recording and collection rates. To get an idea of how we do this, take a look at our web site, and the three new data dropdowns on the right side. Click on the “Data Access” dropdown and you’ll see seven options, of which five give direct access to data.
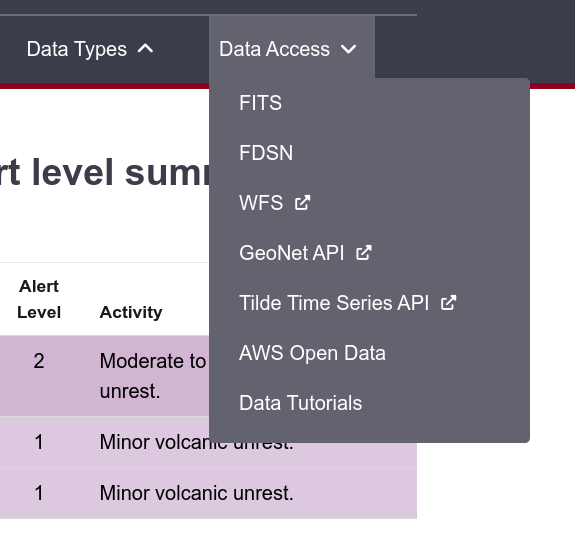
The Data Access dropdown on the GeoNet web site.
That’s it for now
We sometimes get questions about what kind of data we collect and where, but questions about how frequently are far less common. As we hope you can see, it’s still a really important thing to understand as it has important implications for you as a user of our data. You can find our earlier blog posts through the News section on our web page just select the Data Blog filter before hitting the Search button.
We welcome your feedback, and if there are any GeoNet data topics you’d really like us to talk about, please let us know! Ngā mihi nui.
Contact: info@geonet.org.nz