Why does GeoNet collect felt reports?
Have you ever filled out a felt report? Or read about how many felt reports an earthquake received, and wondered what we do with them? Well wonder no more!
Some history
Seismologists began collecting felt reports back in the early 1900s. With no GeoNet and no network of instruments across New Zealand, dedicated volunteers filled in paper questionnaires and sent them to the observatory in Wellington. Pre-1930s these, along with newspaper clippings, were used by scientists to calculate where an earthquake was located. This was difficult in New Zealand as most people lived by the coast, so not much was known about the effects of earthquakes further inland. Here is one from Christchurch in 1921:
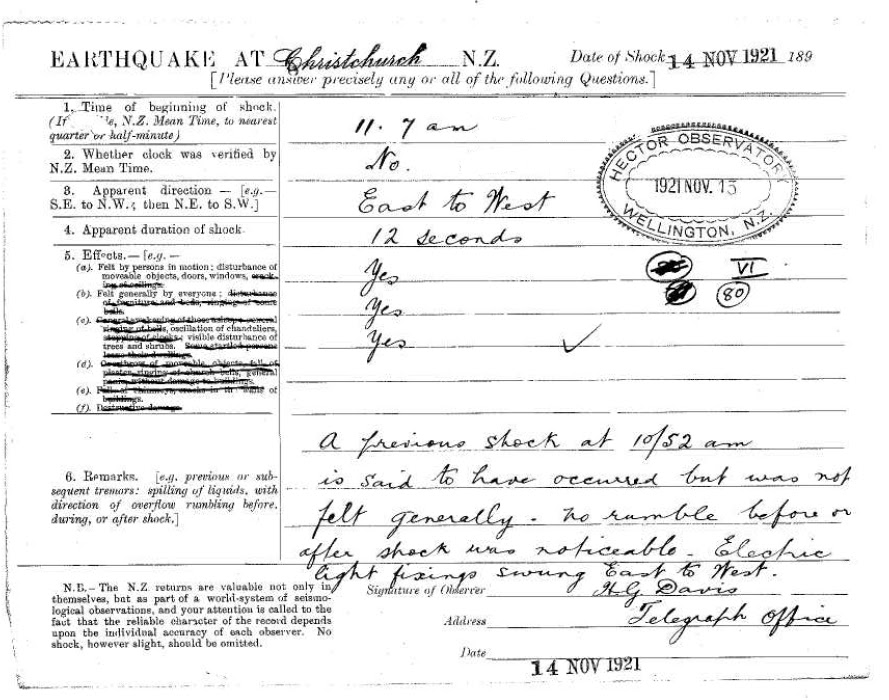
1921 Felt Report from Christchurch
And now?
These days the process is a lot easier and faster. If you have ever submitted a felt report, you will be familiar with our ‘FELT IT?’ earthquake person (and cat). A few swipes and the felt report is done (on our app or via our website).
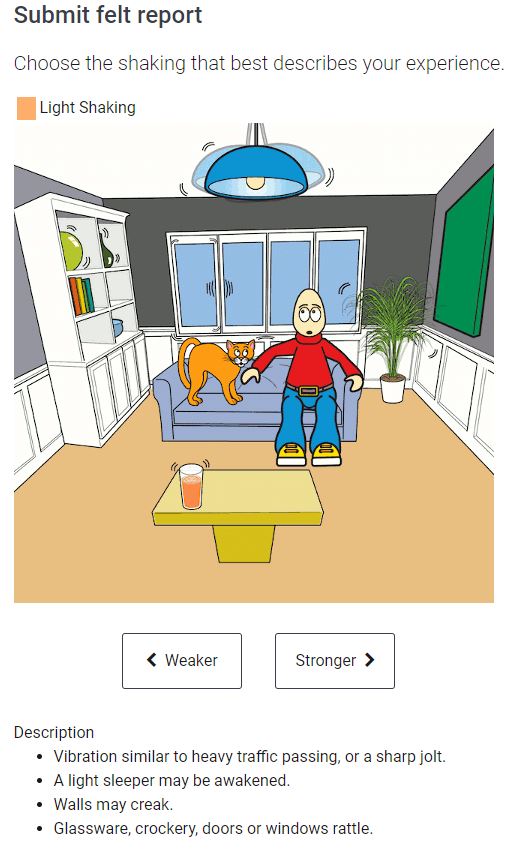
Current Felt Report
So, what do we actually do with them?
We map the reports so we can clearly see how widely and how strongly an earthquake was felt, for example this M5.4 earthquake in January (which received 26,000 reports!). This helps us decide what response we need here at GeoNet, and what information we need to get out to the public. Although our website stats have shown that a lot more people visit our website after an earthquake, to view earthquake information, than actually fill out felt reports!
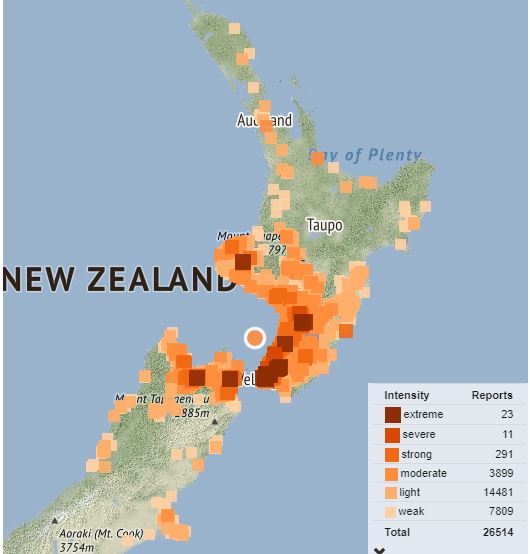
Felt Reports for M5.4 January Earthquake
Who else uses our felt reports?
We spoke with Sarah Stuart-Black, Director Civil Defence Emergency Management:
“Felt reports are a useful tool for us in those first minutes following an earthquake when we won’t have much information immediately available to us about what impacts the earthquake may have caused.
They provide us with a rapid indication of how widely and strongly an earthquake was felt, which helps us make decisions about what follow-up actions may be required, particularly when the earthquake’s magnitude is below our usual threshold for assessment.
An absence of felt reports, where we might normally expect to see a cluster of them after an earthquake, can also be an indication that there may be communications and power outages in the area impacted by the quake – this is what we saw in the felt reports from the 2016 Kaikōura earthquake, where fewer felt reports were registered in Kaikōura compared to other districts nearby.”
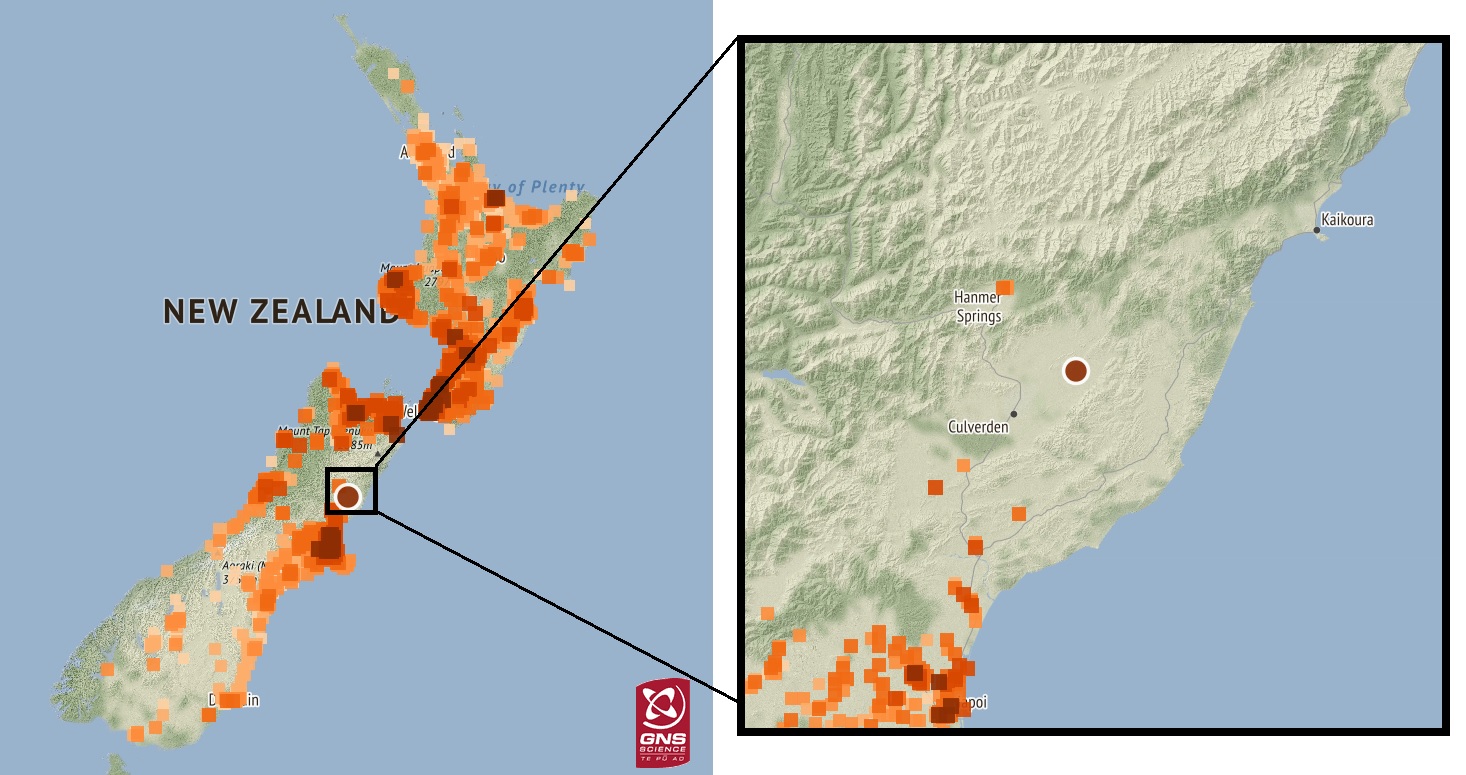
Felt reports for the 2016 Kaikoura earthquake, highlighting the gap in reports around the areas badly damaged.
What about scientists?
Tatiana Goded – GNS Science Seismic Hazard Modeller, filled us in on how scientists use felt reports:
When checking out an earthquake on our website you may have noticed a ‘Felt Detailed’ button, this is a longer questionnaire of around 40 questions. Scientists currently use these to complement the strong-motion data GeoNet receives from its stations around New Zealand determining where areas of most intense shaking occurred. People are almost acting as “human sensors” that help us get a detailed picture of how the shaking was at their location.
‘Felt Detailed’ reports are being used for several research projects, including ‘community intensities’ which provide an easy way to understand the distribution of damage caused by an earthquake in New Zealand. Using these, scientists have created a database of more than 170,000 community intensities.
The detailed felt reports are also being used to analyse human behaviour during and after earthquakes. From this data we can see what actions people are taking, such as ‘Drop, Cover, and Hold’. We can then use this to help monitor the uptake of protective actions and improve public education.
It is also being used for monitoring tsunami evacuation rates, and informing and validating evacuation modelling being undertaken by GNS Science and external researchers. The datasets now contain over 17,000 responses which is by far the largest dataset of its kind globally!
"Completing these detailed felt reports, the public is contributing hugely to science, and helping decision-makers following a damaging event. So, the more 'felt detailed' reports we have, the better picture we have of the damage caused by an earthquake."
We would like to take the opportunity to thank all the people in New Zealand who have generously filled in felt reports (both the long and short versions), providing us with an immensely valuable amount of information. Thank you!
Media Contact: 021 574 541 or media@gns.cri.nz