NIWA’s offshore mapping adds more faults to the latest Kaikoura fault rupture map
The results of NIWA’s sea floor mapping off the Kaikoura and Marlborough coast are now in, adding even more fault ruptures to the fault map of November’s magnitude 7.8 Kaikoura earthquake.
The results of NIWA’s sea floor mapping off the Kaikoura and Marlborough coast are now in, adding even more fault ruptures to the fault map of November’s magnitude 7.8 Kaikoura earthquake. Scientists on board NIWA’s research vessel Ikatere took to the water in January with state-of-the-art equipment to map the sea floor between Cape Campbell and Spyglass Point to the south of Kaikoura. Ikatere is a smaller boat than Tangaroa so it can get closer in to the shore to map how the onshore and offshore faults link up. You can see the team at work in this NIWA video.
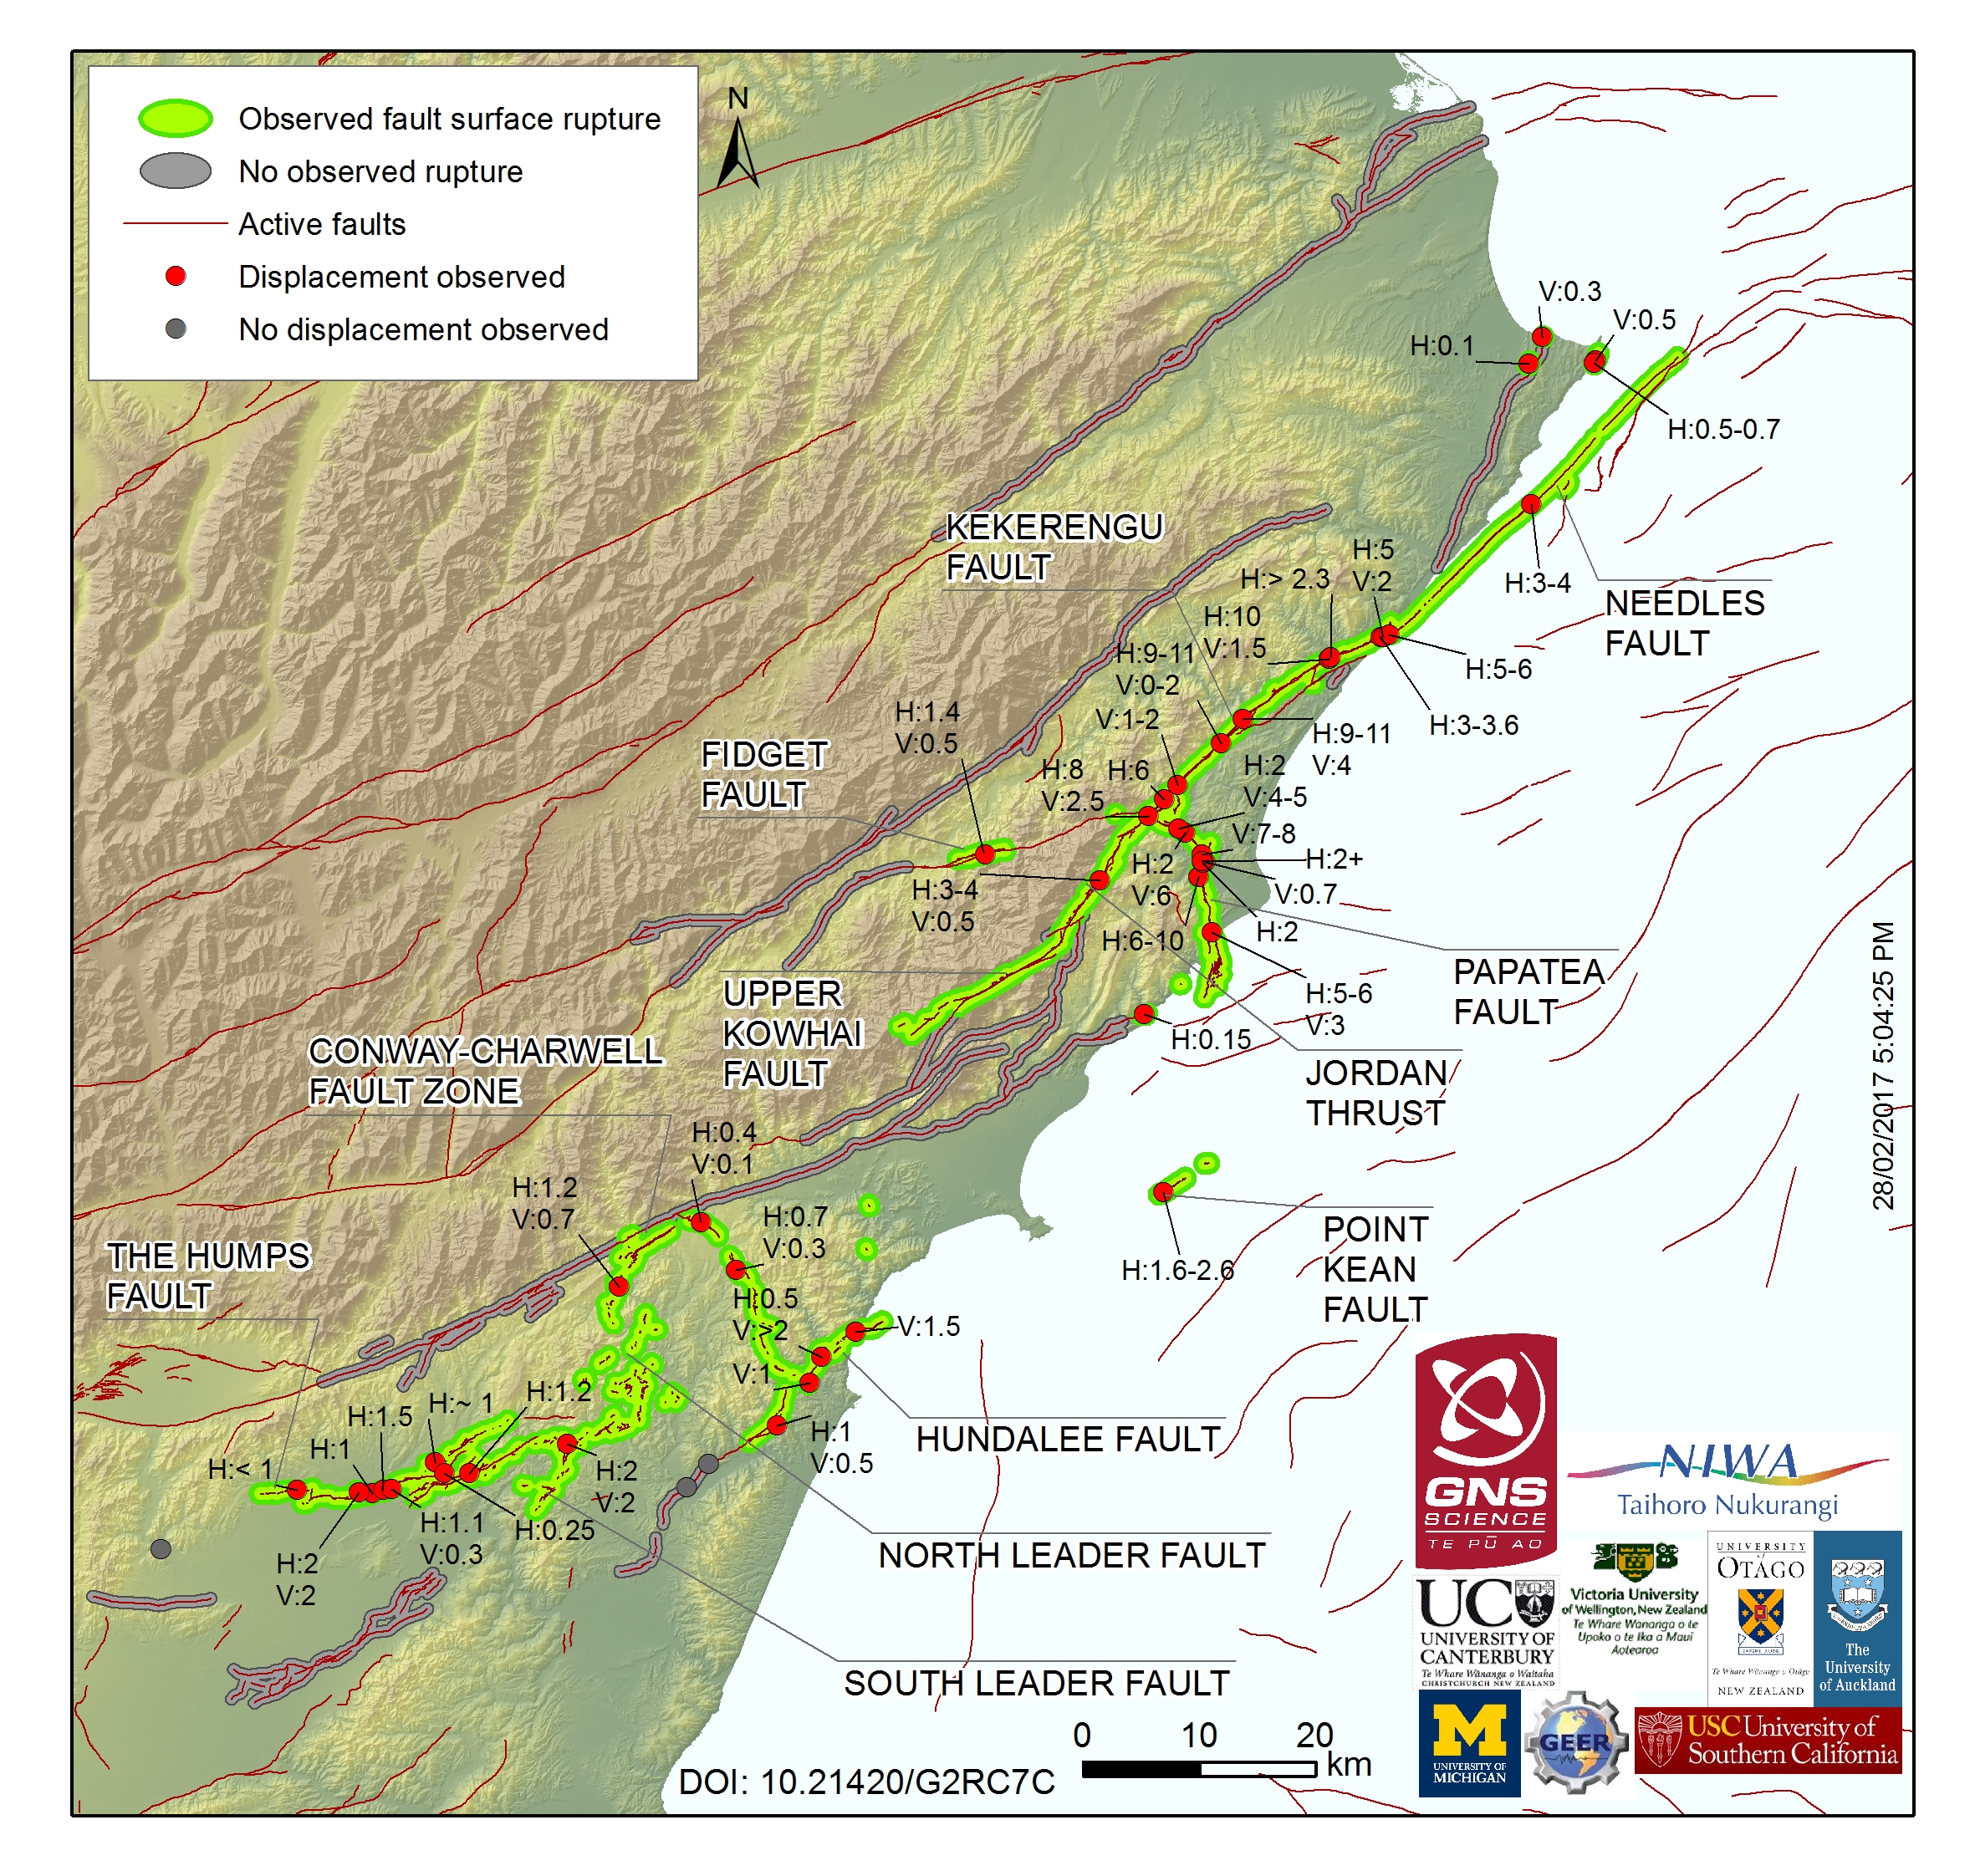
The latest fault rupture map now includes detailed offshore mapping (click for a bigger version)
What did the Ikatere voyage uncover?
The scientists discovered a previously unknown fault in the sea bed about 10km north east of Kaikoura Peninsula. This new fault has been named the Point Kean Fault after Point Kean at the tip of the peninsula. While it is not clear how much this fault moved during the earthquake, it is likely to be the fault responsible for the uplift around Kaikoura Peninsula.
To the north, the Papatea Fault rupture leaves land and breaks into a complex network of seafloor scarps up to 6 metres high continuing for about 5km offshore. The image to the right shows the onshore lidar (high resolution topography) data stitched together with the offshore lidar and new sea bed mapping to reveal two traces of the Papatea Fault cutting the beach and the sea bed.
While movement on the Needles Fault had been detected by scientists on board Tangaroa shortly after the earthquake, Ikatere was able to map it in more detail. Rupture along the fault was traced along the sea bed for a total of 34 km, from Cape Campbell in the north to where it connects up with the onshore Kekerengu Fault in the south.
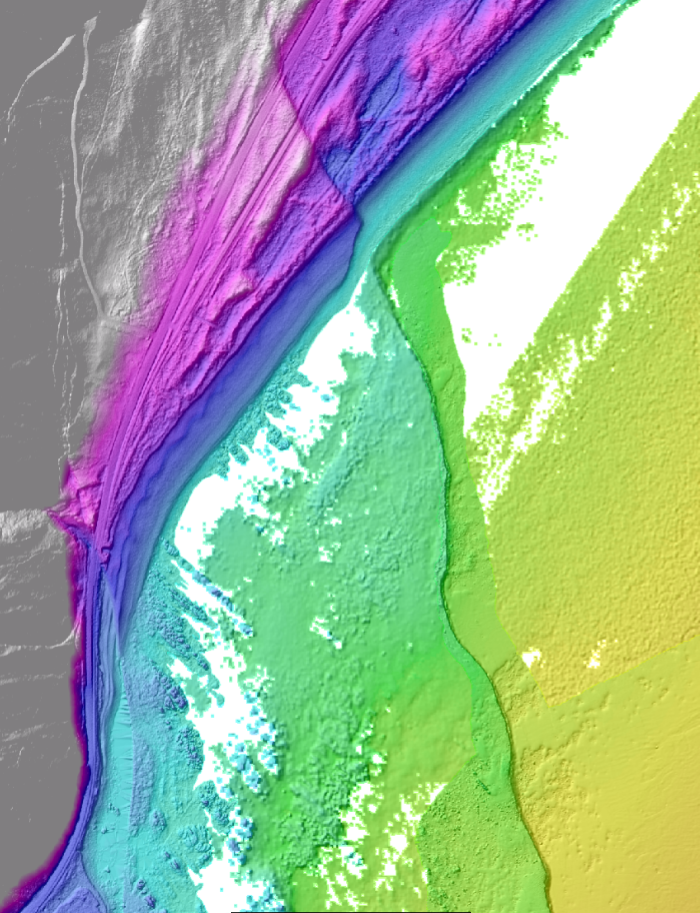
The Papatea Fault where it heads offshore – the grey, pink and purple are above sea level, and the turquoise and green are below. Source: NZTA/NIWA.
The southern-most offshore fault, the Hundalee Fault, was mapped from where it enters the sea at Oaro to near the head of Kaikoura Canyon. Comparing the bathymetry data here to pre-earthquake data from 2013 shows a clear 2 metre high scarp formed in the sea bed, but it doesn’t appear to go all the way into the canyon.
As well as mapping fault scarps, the NIWA scientists also mapped the sea bed in the Kaikoura Canyon, just to the south of Kaikoura Peninsula, to determine any changes to its shape. Comparing this new data to the 2013 data reveals that huge amounts of mud have been shaken from the top of the canyon – more than 1000 landslide scars have been mapped along 30km of canyon rim. This mud tumbled down into the canyon floor and flowed over 350km along the deep sea Hikurangi Channel, wiping out everything in its path. You can read more about the impact of these mudslides on the Canyon ecosystem on the NIWA website.
Meanwhile, back on land...
Geologists from GNS Science, University of Canterbury and Victoria University have continued their field mapping of fault ruptures from North Canterbury through to Marlborough. A new record displacement for the North Canterbury faults of 4 metres was measured on the North Leader Fault.
And back in the office, two new surface ruptures have also been discovered after analysing the lidar data along the coast to the north of Kaikoura – one north of the Kekerengu Fault at Tinline Downs and one crossing Papatea Point. There’s lots more lidar to come, so geologists could yet discover more small surface ruptures like these that can be hard to see in the field.
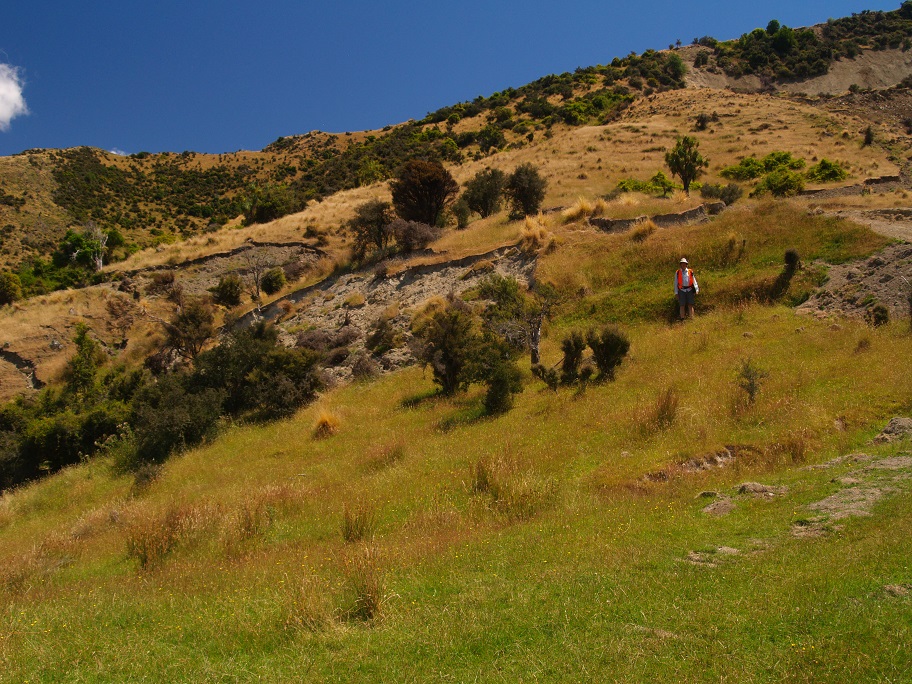
A new record for the North Canterbury faults – what looks like a landslide is actually a 4 metre high fault scarp. Photo: Clark Fenton, University of Canterbury.
Science contacts: Dr Joshu Mountjoy (NIWA) and Dr Nicola Litchfield (GNS Science)
Deployment of Ikatere was made possible by MBIE funding to the Natural Hazards Research Platform for immediate response to the Kaikoura earthquake.