
Changes to our felt report maps
We map felt reports to identify how widely and how strongly people experienced earthquake ground shaking. From tomorrow you will notice changes to the felt report maps that we provide on our website.
Research comparing submitted felt reports to measured shaking recorded by our instruments has prompted a change to how we display felt reports on our shaking maps. Our maps will now display the median (middle) shaking intensity experienced in a particular area, rather than the maximum. This change will allow our maps to better reflect how most of the people that completed a felt report felt shaking at their location. Here is what the new felt report map will look like (image to the right) compared to our current maps (image on the left) using a recent M5.6 earthquake as our example.
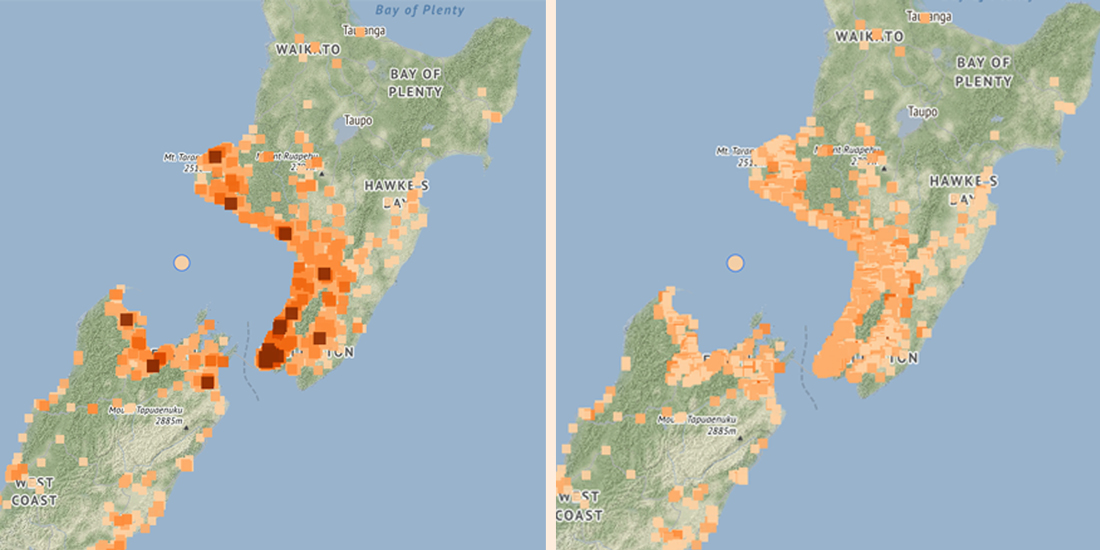
How the Shaking Map for the M5.6 earthquake looks currently (left) and how it would look from tomorrow (right)
When looking at the current map on the left, it appears a large number of people described their experience of the earthquake shaking as ‘extreme,’ when in fact, of the 20,739 reports we received, the number of extreme felt reports was only 46. The new map on the right better illustrates how the earthquake shaking was felt, with most people feeling light (10,298 reports) and weak (7,961) shaking.
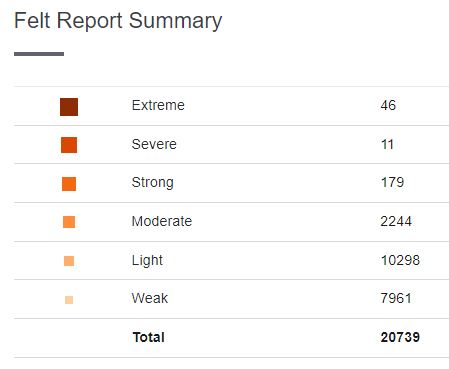
Felt reports received for the M5.6 earthquake
Each of the individual squares on our shaking map contain all felt reports received within approximately a 1km area. We group them in this way to protect your privacy. The square tiles overlap with one another (when we're zoomed out) so the map display layers the tiles with the most felt reports on top and the ones with fewer reports are underneath. This helps mitigate some of the sparser areas where one report might say extreme, but nearby ones are weak/light.
Every felt report we receive is collated in the ‘total reports’ summary on each shaking map, and all of the data is available via the GeoNet API.
We hope you will like this change. It is one of a few we plan to introduce to the GeoNet website and app over the coming months to improve the quality of the information we collect and provide. Stay tuned!
Earthquakes can occur anywhere in New Zealand at any time. In the event of a large earthquake: Drop, Cover and Hold.
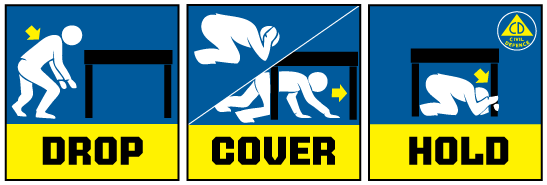
Drop, Cover and Hold
Remember Long or Strong, Get Gone : If you are near the coast and feel a strong earthquake that makes it hard to stand up OR a weak rolling earthquake that lasts a minute or more move immediately to the nearest high ground or as far inland as you can, out of tsunami evacuation zones.
Know what to do?
The National Emergency Management Agency (NEMA) has a great website with information on what to do before, during and after an earthquake.
Prepare your home. Protect your whānau.
There’s a lot we can do to make our homes safer and stronger for natural disasters. Toka Tū Ake EQC’s website has key steps to get you started.
Media Contact: 021 574 541 or media@gns.cri.nz