Eketahuna Future Scenarios and Aftershocks
The following scenarios and probabilities were first compiled for the Eketahuna earthquake just days after its occurrence. They represented a breakthrough in the presentation of earthquake knowledge - a guarded look into the future!
As at June 2014, what did we expect to happen next?
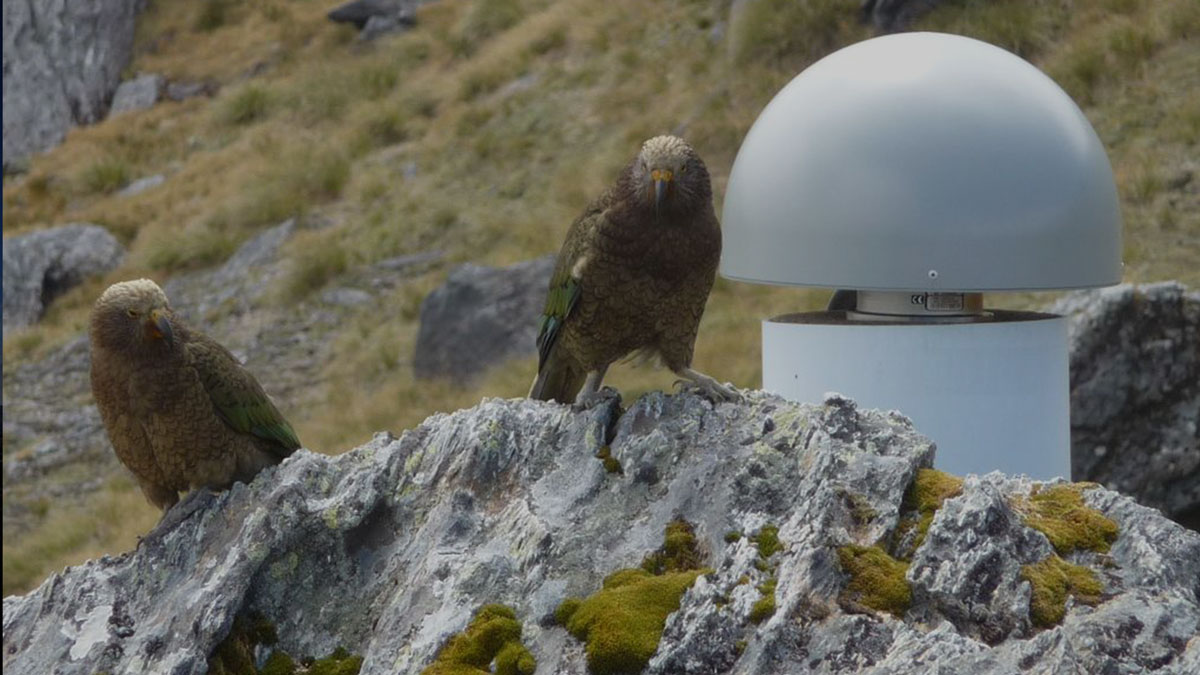
We would all like to know what will happen next! The M6.2 Eketahuna earthquake occurred in a seismically active area of New Zealand that extends from Wellington to the Gisborne region. It is a geologically complex area where the Pacific tectonic plate is being subducted beneath the Australian plate at a rate of approximately 42mm per year. The Eketahuna earthquake occurred in the subducting Pacific plate and the aftershocks occurred mostly in the Pacific plate rather than the overlying Australian plate (see image below).
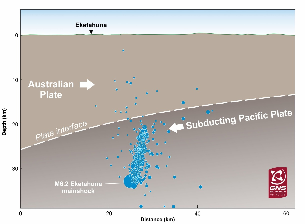
Cross-section through the earth below the Wairarapa. The mainshock and most of the aftershocks were occurring in the crust of the Pacific plate, which is diving below the Australian plate. Aftershocks between 20-22 January are plotted.
The complex nature of the area means there are a few possibilities for what may happen next. History can give us a clue: since 1940, there have been 31 earthquakes of similar magnitude in this area each with their own aftershock sequence. Included in the total of 31 quakes, there have been two historical examples (see Scenario Two) where a large earthquake has been followed by quakes of a similar or greater size. These two examples have been the subject of discussion at GNS Science over the last couple of days. You can read about New Zealand's historical quakes here.
Based on our understanding of tectonics in the region, data from the current quake, historical observations, and statistical models, scientists considered that there were three possible scenarios that could occur over the following weeks. There are very different probabilities for each scenario. The best thing is to be prepared for whatever happens next.
These scenarios are here for historical information only. The probabilities have now returned to pre-January 2014 levels.
Scenario One - Very Likely (over 98% within 30 days)
Aftershocks will continue to decrease in frequency as expected (and in line with forecasts), remaining relatively deep (i.e. deeper than 25 km) in the Pacific plate.
Scenario Two - Very Unlikely (1% within 30 days)
Another earthquake occurs, with a similar size - magnitude 6 to 7 - to the Eketahuna quake. The earthquake could be at the same depth as the current aftershocks, in a nearby part of the Pacific plate. Or the quake could be centred at a shallower depth (i.e. less than 25 km) in the overlying Australian plate. If a shallower earthquake happens, there may be stronger shaking at the surface than the Eketahuna earthquake.
There are two examples in the east of the North Island where a large earthquake was followed by an earthquake(s) of similar or greater magnitude. In the first example, a magnitude 6.9 earthquake in June 1942 near Masterton was followed by two subsequent events, a magnitude 6.8 in August and a magnitude 6.0 in December the same year.
In the second example, a magnitude 5.9 earthquake in February 1990 near Weber and Porangahau was followed by a magnitude 6.2 earthquake in May 1990 in the same area, which damaged buildings near Weber.
Scenario Three - Extremely Unlikely (less than 1% within 30 days)
A larger magnitude quake - greater than magnitude 7 - on the 'plate interface' (the transition between the Pacific and Australian plates) is extremely unlikely, however, as with many places in New Zealand an earthquake of this size can occur at any time. The chances of one occurring are temporarily increased by the Eketahuna earthquake, in the area outlined in the box in the map below. The expected intensity of shaking from these earthquakes has already been built into the New Zealand Seismic Hazard Model, which is used by the engineering community to design buildings that can withstand intense shaking in New Zealand.
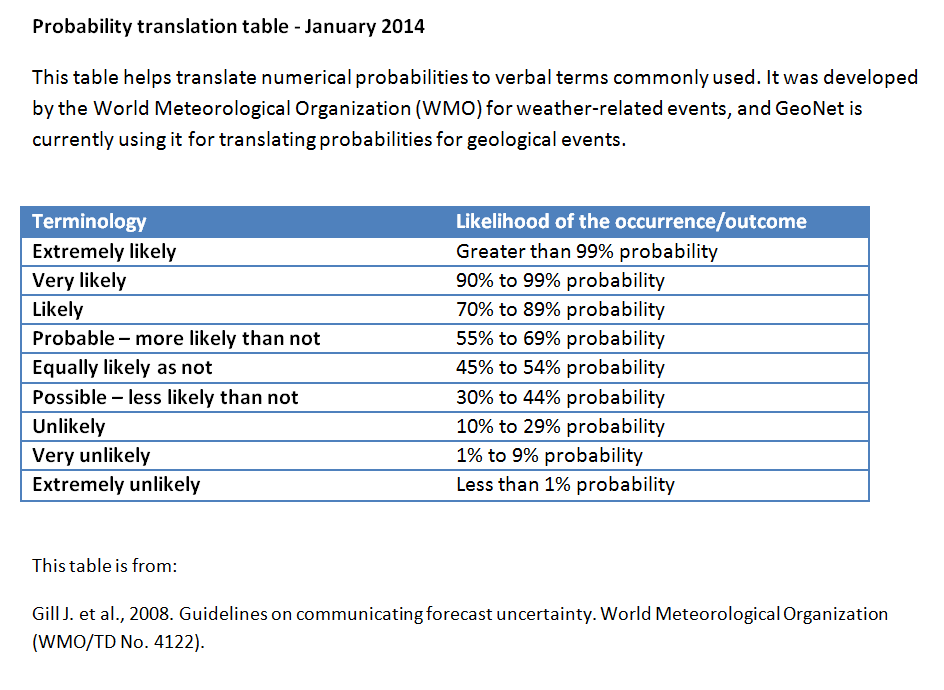
Probability translation table
What were the forecast probabilities in June 2014?
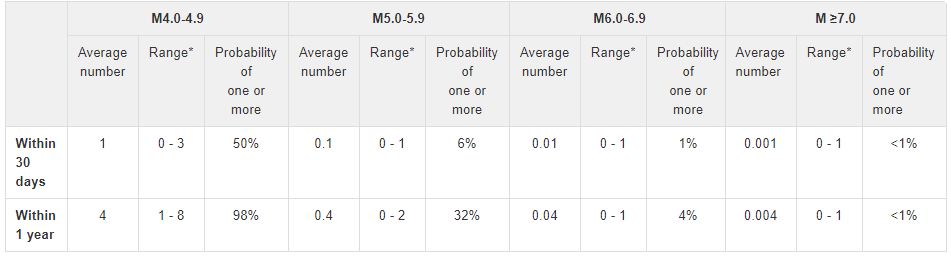
Aftershock Forecast Probabilities
*These were last issued on 1 June 2014 for the coming month within the region shown in the accompanying map. The probabilities have returned to pre-January 2014 levels. * 95% confidence bounds.*
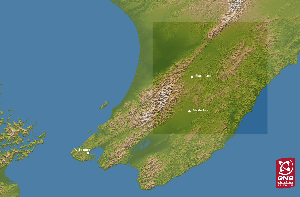
Map showing the region for which earthquake probabilities were calculated, indicated by the white box