Tell us your thoughts on earthquake shaking information after an earthquake.
We want to make sure we are delivering information you need after an earthquake, so researchers at GNS Science have developed a survey about information on earthquake shaking and what you would like to see online from GeoNet after a large earthquake.
The short survey will go through questions on the different types of information that could be available after an earthquake. This will help us with new content on the website and will also be valuable for ongoing research projects. Whether you use the GeoNet website, app, Facebook or Twitter pages, we are keen to get your views.
The survey shows maps that are examples from the 2016 Kaikōura earthquake that were produced by the United States Geological Survey and we appreciate you taking the time to complete it.
The Shaking Layers Project
The GNS Science “Shaking Layers” project is aiming to provide shaking intensity maps minutes after a New Zealand earthquake of magnitude 3.5 or above. These maps differ from existing GeoNet strong motion and felt report maps in that they will use instrumental data from the strong-motion sites, felt report data from “Felt Detailed” and “Felt RAPID” questionnaires, and earthquake rupture information as it becomes available, to provide a realistic shaking distribution of the earthquake across the country. The maps provide intensity data (e.g. the level of shaking, in a scale 1-11), peak ground acceleration, peak ground velocity, and other spectral acceleration parameters. These shaking maps will cover the entire country instead of providing data only at the locations of the sensor or the felt reports. This means that you will be able to look for the shaking at any given point in the country. Interactive maps will also be made available where users can zoom in and out and turn on different type of information.
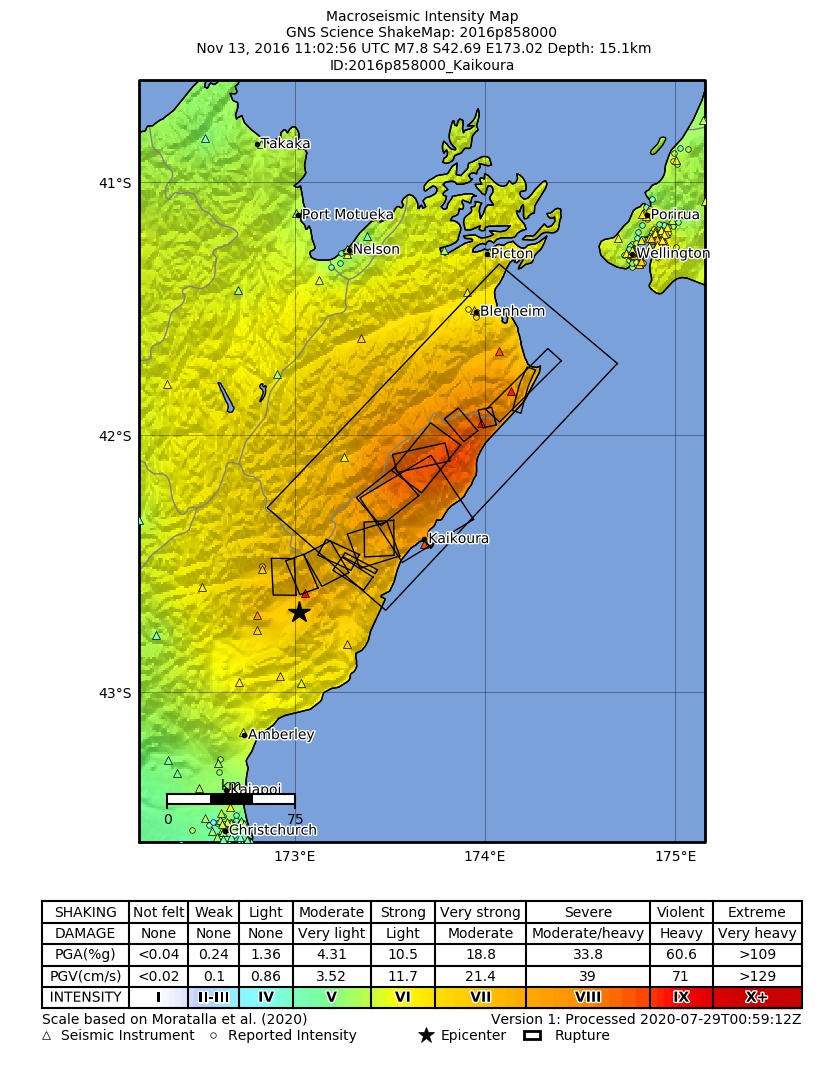
Example of a GNS Science produced Shaking Intensity Map for the Kaikōura earthquake in 2016.
This project is aiming to make shaking intensity maps available to the public by December 2022. The GNS Science “Shaking Layers” project is a collaborative effort between the GeoNet programme and the Rapid Characterisation of Earthquakes and Tsunami (R-CET) MBIE Endeavour Programme.
If you require further information, or have any concerns about the study, please do not hesitate to contact us.
Attributable to: Danielle Charlton, Tatiana Goded, GNS Science
Media contact: media@gns.cri.nz or 021 574 541