Volcanic Alert Bulletin TON-2012/15 - Tongariro Volcano
A new map of volcanic phenomena for Northern Tongariro has been released. This has been produced by GNS Science using modelling of volcanic phenomena at Massey University and with expert input from both GNS Science and Massey University. It shows the currently most hazardous areas around the mountain.
During the past two weeks, GNS Science has been working with Massey University, Department of Conservation and the Taupo and Waikato Civil Defence and Emergency Management Offices to develop an updated map of volcanic phenomena that might be experienced during an eruption of Tongariro Volcano as part of the current unrest episode. The aim is to inform the public about which areas are more hazardous and should be avoided during an eruption. A similar map was produced in late 2007 covering the summit of Mount Ruapehu during the unrest period following an eruption there.
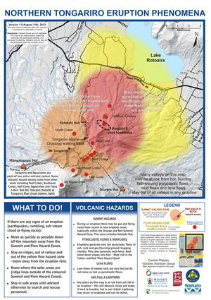
Northern Tongariro phenomena map
The map was developed using knowledge of the geological history of Tongariro, experience from other similar volcanoes internationally, volcanological expert opinion as well as mathematical modelling of possible phenomena undertaken at Massey University. For the modelling, scientists used a range of scenarios including different vent locations and different volumes of ejecta.
The map builds on a long term hazard map for awareness during times without obvious volcanic unrest that was developed for the whole of Tongariro in 2007. The new map includes a new zone to the north of Te Māri where the explosion on 6 August occurred.
This new zone shows areas that are at risk from volcanic flows (red and yellow on the map). These include mudflows, pyroclastic (hot ash) flows and lava flows. Mudflows are more likely during heavy rain and will be channelled down river valleys. Pyroclastic flows only occur during explosive eruptions and may not be confined to valleys. Both pyroclastic and mudflows can travel fast (up to around 100km/h for mudflows or much faster for pyroclastic flows). Lava flows tend to be slow moving.
The most hazardous zone is within approximately 3km of the area of potential new vents on the northern flanks of Tongariro – the summit hazard zone (red and orange on the map). Helicopter observations of the deposits by scientists this week have shown multiple impacts in this zone from flying rocks during the 6th August eruption, especially close to the vents.
The area within both the flow and summit hazard zones is coloured red.
Currently the activity of the volcano is quiet, and there are no signs of an imminent eruption. We would likely expect to see an increase in unrest indicators prior to eruptions larger than the explosion on 6th August.
Due to the potential hazards and the fact that they could affect state highway 46, authorities are recommending that people do not stop their vehicles while travelling along State Highway 46 in the potential hazards area. The New Zealand Transport Agency has erected signage to this effect along the road.
The map may be updated as more information about the status of the volcano becomes available.
GNS Science, Civil Defence and other agencies are working together closely on planning to ensure effective and timely reaction to various future eruption scenarios.
Hazard maps are common tools used by volcano monitoring agencies and emergency management officials around the world to inform the public about the threats from volcanic phenomena.
For further information, contact:
Dr. Gill Jolly Head of Volcanology, GNS Science
Dr. Graham Leonard Volcanologist, GNS Science