
Science Alert Bulletin WI-1999/13 - White Island Volcano
30 November 1999, 12:00 pm - Update
No eruptions have occurred at White Island since the minor ash emissions in July-August 1999 from the PeeJay vent area. A crater lake now occupies much of the floor of 1978/90 crater complex, having inundated Metra Crater and parts of the PeeJay vents area.
Outlined below are observations following a visit on Tuesday (23 November) to service the seismic installation, conduct a deformation survey, collect volcanic gas samples and assess the general status of volcanic activity on the island.
Observations
During our visit a weak steam and gas plume was rising 300 - 500m; This plume originated from fumarole vents situated northwest of the former PeeJay vents. Since the last surveillance visit in July a crater lake has developed on the floor of 1978/90 Crater Complex having inundated Metra Crater and parts of the PeeJay vent area (Fig. 1). A series of strand lines around the crater lake edge indicated a recent drop in the lake level. Small collapse pits had recently formed near the lakeshore, below the Sag area and may have accompanied the recent drop in lake level. The lake is a lime green colour, with minor convection of lake waters. A temperature of 45°C was measured, down slightly on the previous measurements.
The strongest fumarole vents are on the northwest side of the PeeJay vents area, emerging from the vent wall, which is about 10 - 15m high. There are three prominent vents, which were emitting steam and gas. They were weakly transparent at the vent. At times the steam and gas plume appeared a yellow colour. They were audible from 2 - 300m distance. Temperatures of Main Crater fumaroles ranged from 103 to 115°C, and are similar to previous measurements this year.
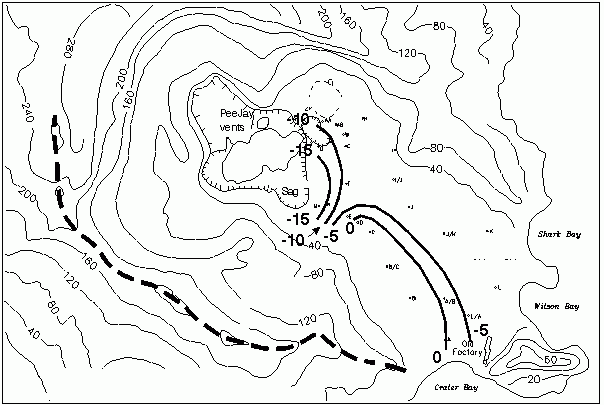
Figure 1: Sketch map showing location of survey pegs, contours of height changes (mm) and location of the new crater lake.
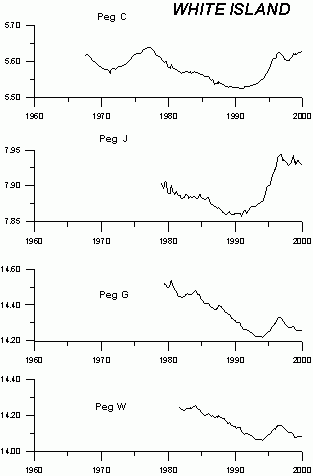
Figure 2: Time series plot showing height changes (m) of selected pegs.
A ground deformation survey was also made. Eight pegs were replaced, as these were damaged during the April - July 1999 eruptions. The survey results show subsidence continues about the eastern-southeastern margin of 1978/90 Crater Complex (Fig. 1), but at a lesser rate than observed in 1998. Over the remainder of the Main Crater floor weak subsidence is also apparent at many of the marks. Time series plots for selected marks are shown in figure 2.
Alert Status
The Volcanic Alert Level remains at Level 1.
Brad Scott
Volcano Surveillance Co-ordinator