RSAM & SSAM
Volcanologists frequently use two other display techniques called RSAM and SSAM.
What is RSAM and what does it show?
RSAM stands for Real-time Seismic-Amplitude Measurement. It represents the overall signal size over periods of 10 minutes. In situations when the number of earthquakes is so high that individual earthquakes can't be seen, or the level of volcanic tremor is such that seismograms no longer show a change in signal level, then RSAM is an excellent way of showing changes with time.
A problem with RSAM is that it measures the overall signal size regardless of what produces the signal. If the signal is caused by volcanic tremor then RSAM is very useful. But when the wind blows strongly the RSAM value will still go up and scientists don't learn anything about the volcano, only the weather!
In Fig. 1, peaks in RSAM caused by volcanic tremor at Ruapehu in July 2006 are shown. On its own there is nothing about the RSAM peak that tells you if it is caused by volcanic tremor, or say wind or some other non-volcanic source.
An example of RSAM from Ngauruhoe in October and November 2007 is shown in Fig. 2. The large peak on 16 October is caused by a magnitude 6.7 earthquake in Fiordland. The other smaller and wider peaks are all due to ground shaking caused by strong wind.
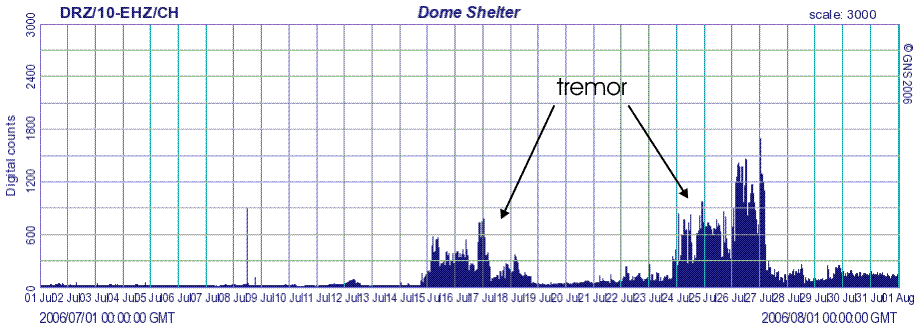
Figure 1: RSAM plot for Ruapehu with volcanic tremor.
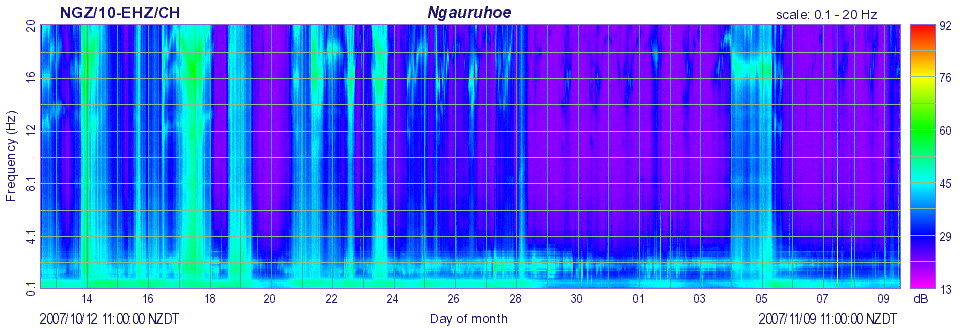
Figure 2: SSAM plot for Ngauruhoe, showing wind noise.
What is SSAM and what does it show?
SSAM stands for Seismic Spectral-Amplitude Measurement. It shows the relative signal size in different frequency bands (see Figs. 3 and 4). Different seismic signals have energy at different frequencies. To use a musical analogy, different seismic signals produce different notes or tones; SSAM shows the strength of each tone in the overall sound. The stronger the signal the 'warmer' the colour. Purple is the coolest colour, while red is the warmest.
Using SSAM it is possible to get an idea of whether a signal is produced by earthquakes, by wind or traffic noise, or by volcanic tremor. Earthquakes, wind and traffic noise all tend to have energy at a wide range of frequencies (a wide-band signal), while volcanic tremor tends to have energy in a more limited range of frequencies (a narrow-band signal).
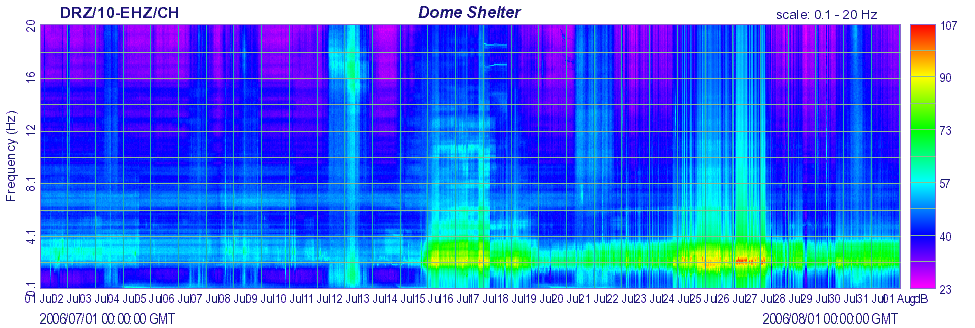
Figure 3: SSAM plot for Ruapehu with volcanic tremor.
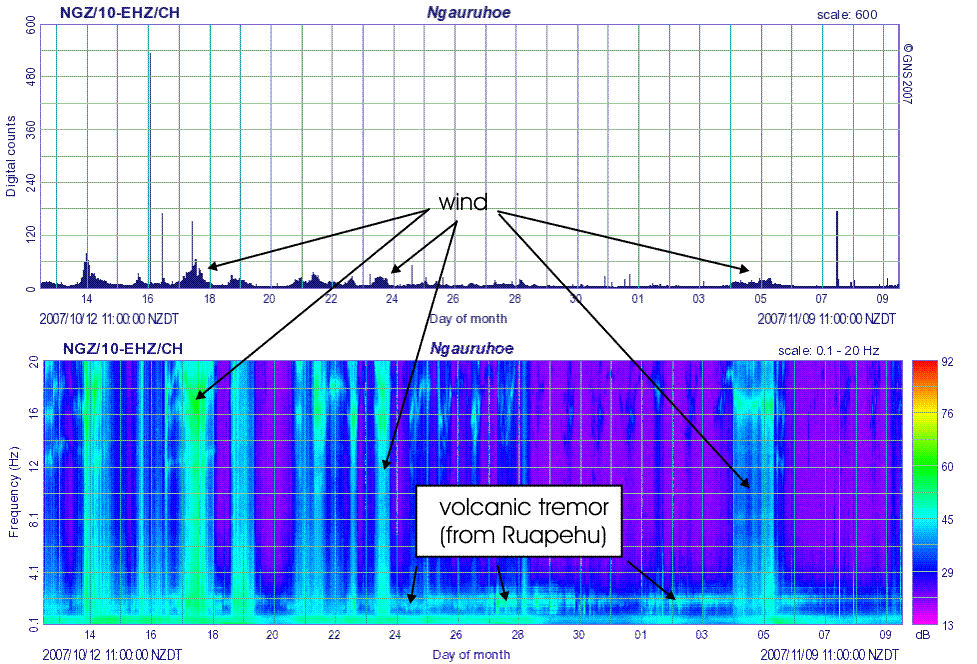
Figure 4: RSAM and SSAM plots showing affect of wind.
Which is best, RSAM or SSAM?
Neither. The key is to look at RSAM and SSAM plots together. RSAM will give a measure of the signal size and SSAM more information on the likely source of the signal. See how the wind differs from the volcanic tremor in Fig. 5. Sometimes the wind is more prominent than the volcanic tremor, hence some of the difficulties volcanologists face understanding volcanic activity.
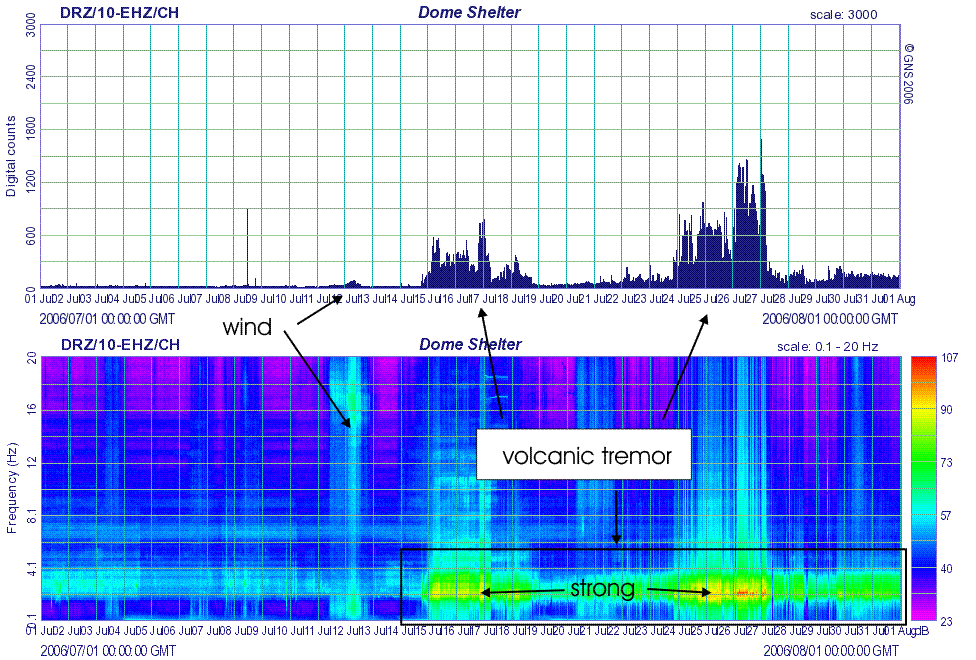
Figure 5: RSAM and SSAM plots showing volcanic tremor.
RSAM and SSAM images
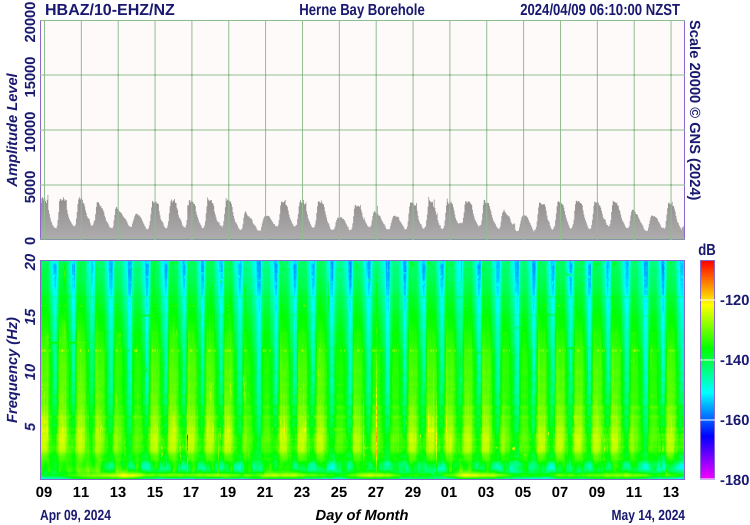
These images are used to appraise the frequency of local earthquakes and the level of ground tremor at a volcano.
The production of these images is computationally intensive so there is no guarantee that the images are available for every site, nor that the style of the images will stay the same. A typical set of images for a volcano monitoring site are:
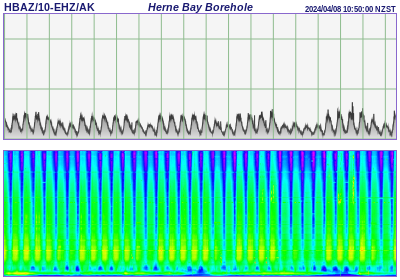
- http://images.geonet.org.nz/volcano/drums/latest/hbaz-seismic-combined.png
- http://images.geonet.org.nz/volcano/drums/latest/m-hbaz-seismic-combined.png
The above URLs point to the latest images for the seismometer at site HBAZ. As long as we need to produce images for this site and there is a seismometer at the location then the URLs are valid. For more information about each seismic site, including opening and any closing dates, see our DELTA database. You may also wish to view the seismic network maps or read about how we interpret these images.