M 6.5 Cook Strait Sun, Jul 21 2013
This earthquake followed two earlier shakes of magnitude 5.7 and 5.8 in the previous two days. It caused damage to buildings on both sides of Cook Strait.
- Magnitude: ML 6.5
- Casualties: Four minor injuries reported
ShakeMap
The accompanying map is a ShakeMap, a product from the United States Geological Survey. The description from their website says: "A ShakeMap is a representation of ground shaking produced by an earthquake. The information it presents is different from the earthquake magnitude and epicentre that are released after an earthquake because ShakeMap focuses on the ground shaking produced by the earthquake, rather than the parameters describing the earthquake source. So, while an earthquake has one magnitude and one epicentre, it produces a range of ground shaking levels at sites throughout the region depending on distance from the earthquake, the rock and soil conditions at sites, and variations in the propagation of seismic waves from the earthquake due to complexities in the structure of the Earth's crust." (Read more here).
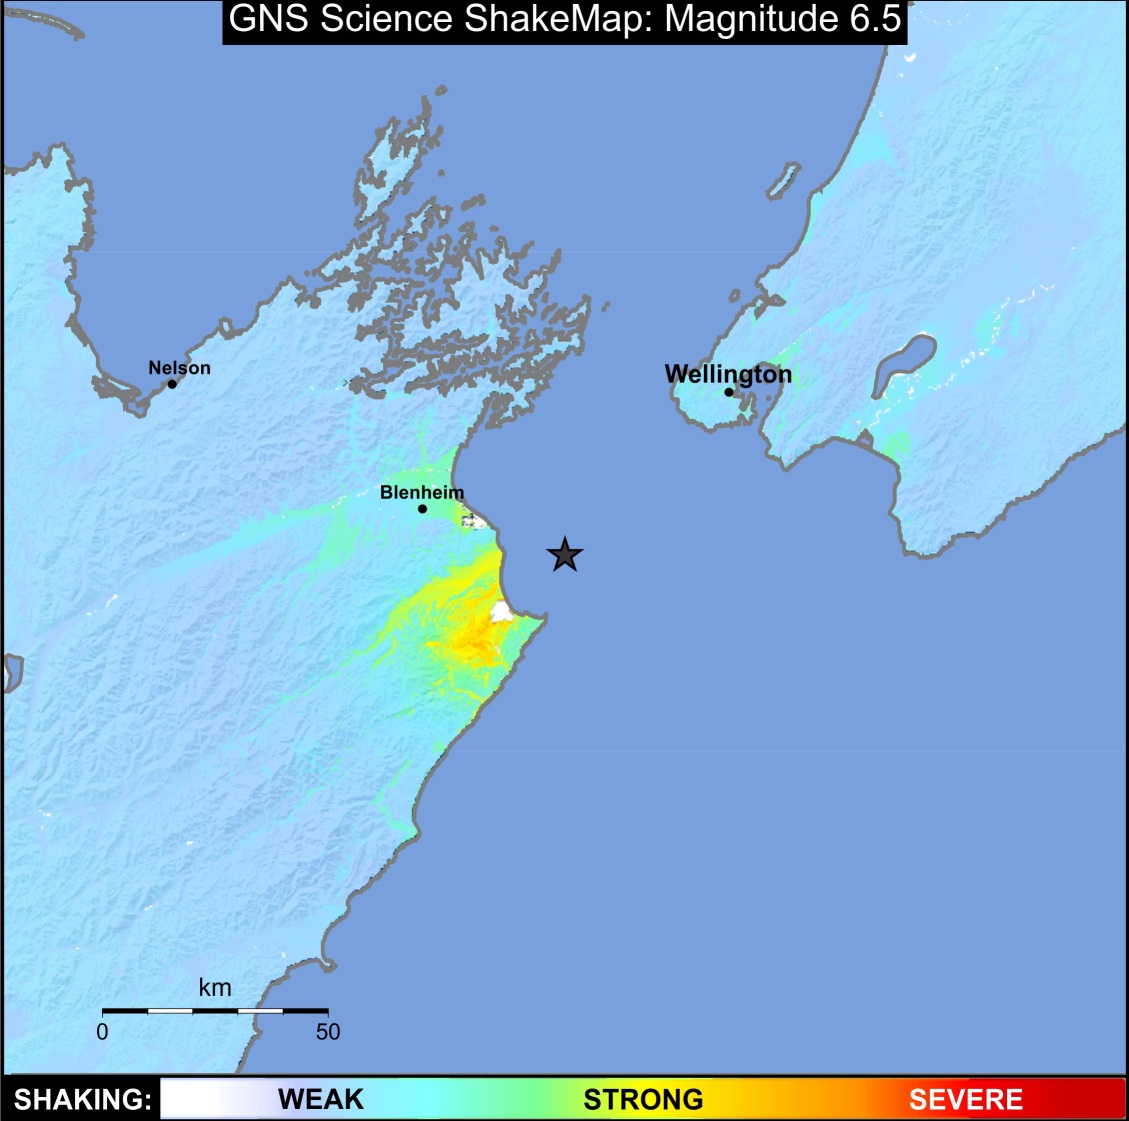
The ShakeMap showing the shaking intensity as determined by GeoNet instruments and modelled against ground conditions. (This is still in 'beta' testing and will be refined before official release).
We are planning to bring you ShakeMap in the near future for all our bigger earthquakes.
Cook Strait and Christchurch earthquakes compared
At magnitude 6.5, the Cook Strait earthquake was larger than the magnitude 6.3 event in Christchurch in February 2011. But the ground accelerations felt in Christchurch were about ten times as strong as those felt in Marlborough and Wellington.
The Christchurch February 2011 earthquake recorded peak ground accelerations (PGA) of more than 2g, while the strongest readings for the Cook Strait earthquakes were approximately 0.2g at Ward (about 16km south east of the epicentre) and even less (up to 0.16g) in Wellington and Porirua. ("g" is short-hand for the earth's gravitational acceleration constant.)
The main factor causing the very large accelerations in Christchurch was the proximity of the epicentre to the city. Christchurch central city was less than 10 km from the destructive Christchurch earthquake. Whereas during the Cook Strait earthquake, the nearest recording station was located approximately 30 km away in Ward. Furthermore, other factors are also thought to have contributed to the exceptionally high accelerations in Christchurch, such as a particularly high energy earthquake source and the fault geometry which directed greater energy towards the city. Our early impression of the Cook Strait earthquake is that these other factors are not necessarily present.
Peak ground acceleration is just one measure of how strongly the ground surface shakes in an earthquake and doesn’t take into account other components such as duration or frequency of shaking. Furthermore, the way the earthquake is felt depends on local conditions such as the type of soil and building. People in tall buildings for instance may experience greater accelerations or longer duration shaking.
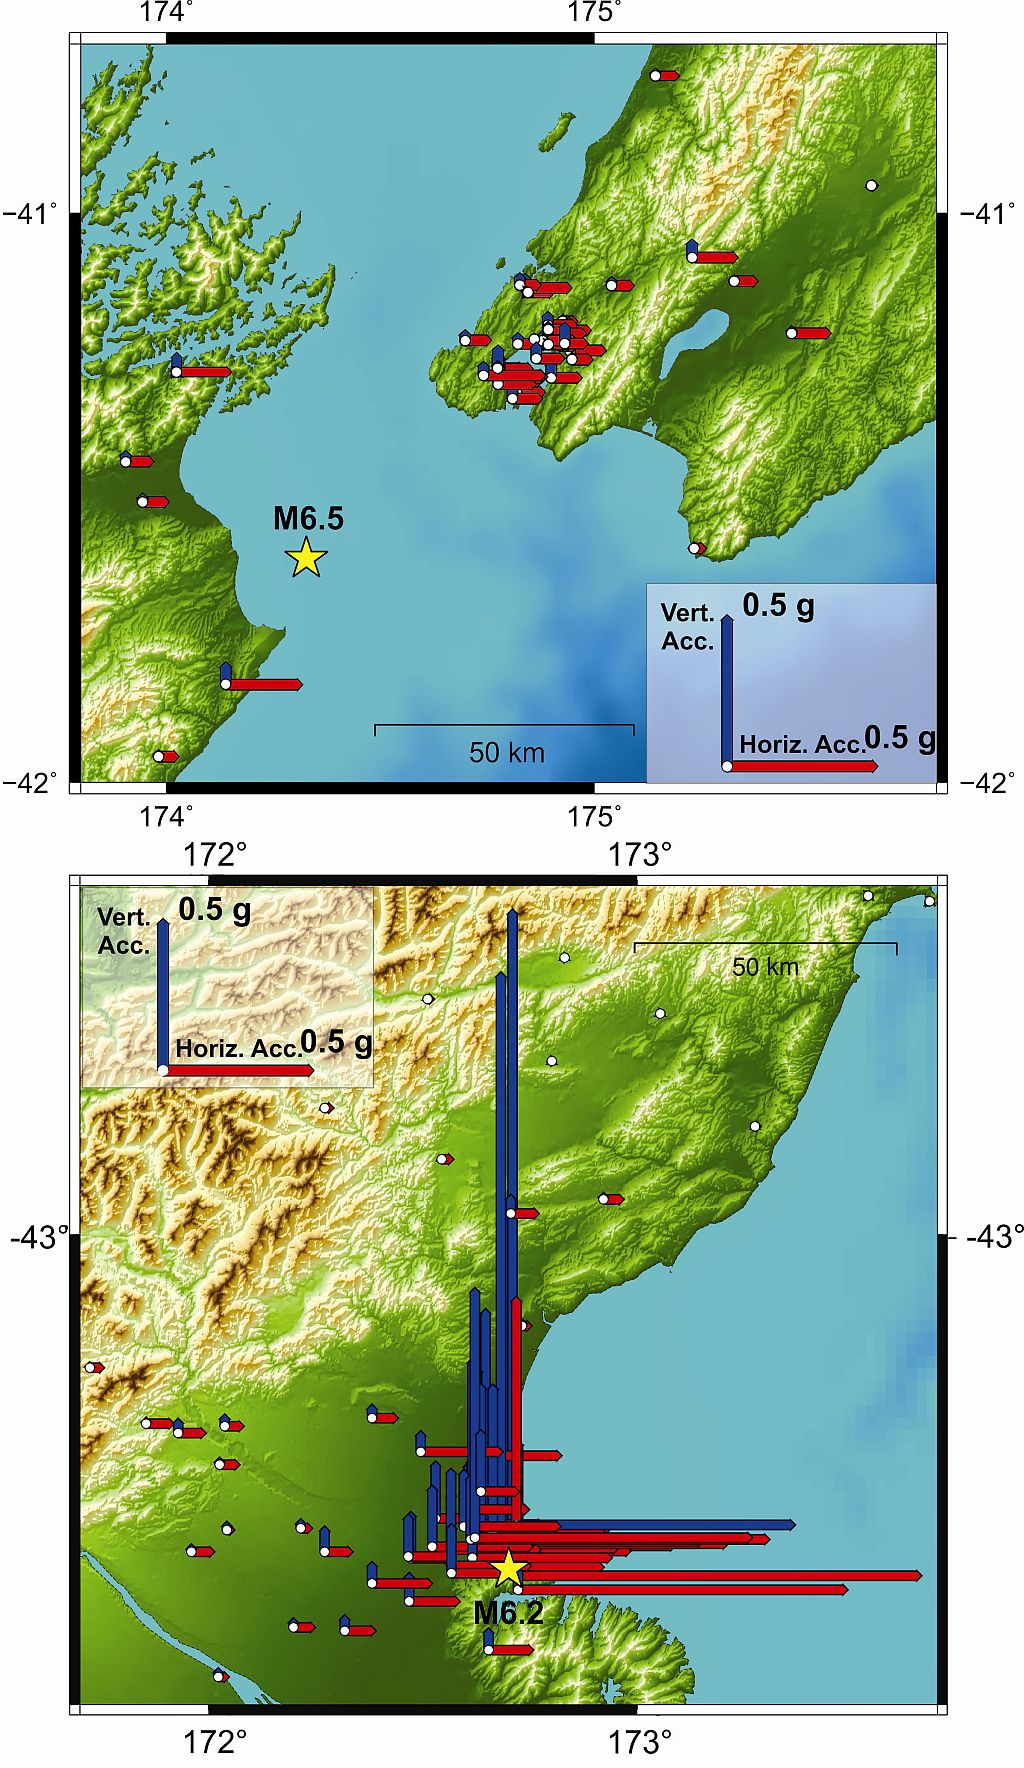
Two maps comparing accelerations measured for the Cook Strait (upper) and Christchurch (lower) earthquakes.
Focal Mechanisms
Focal mechanisms or fault plane solutions show the fault and direction of slip. Focal mechanisms of the Cook Strait earthquake sequence are shown in the accompanying maps. The blue focal mechanisms are for earthquakes prior to the M6.5 quake, and the red ones include it and its aftershocks. The blue mechanisms indicate reverse faulting, whilst the red ones have predominantly strike-slip mechanisms. Landslide reconnaissance
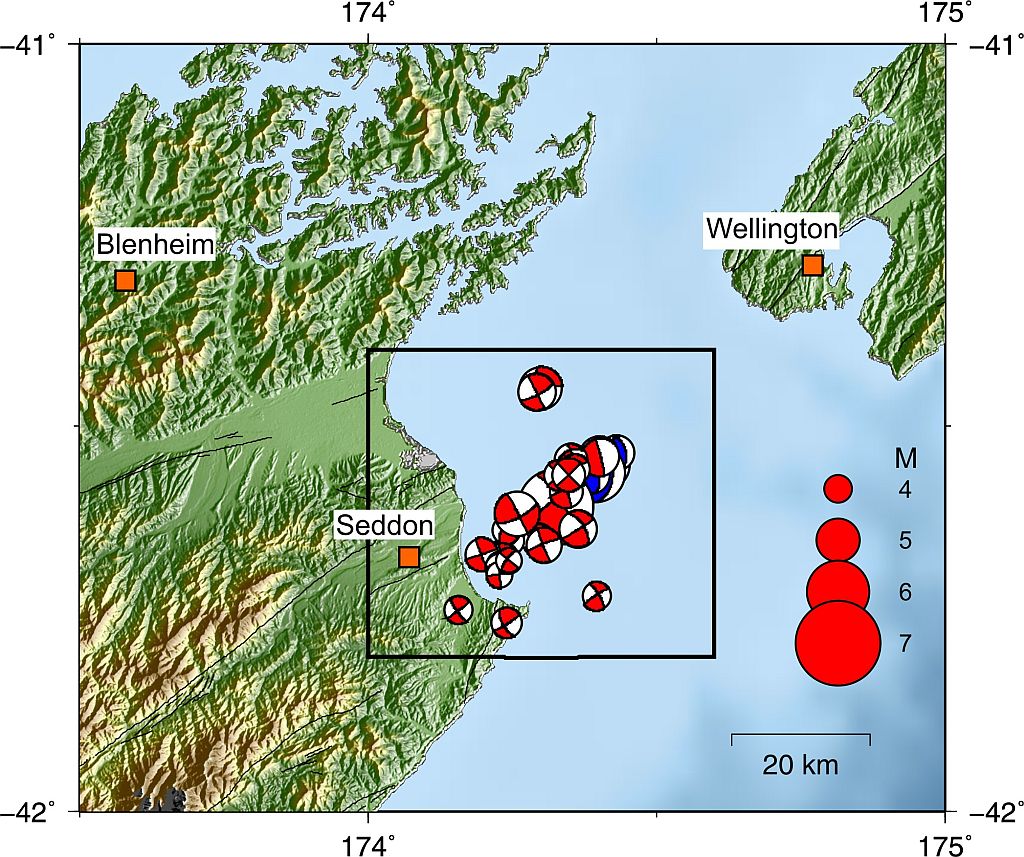
Focal mechanisms for the largest earthquakes in the Cook Strait sequence.
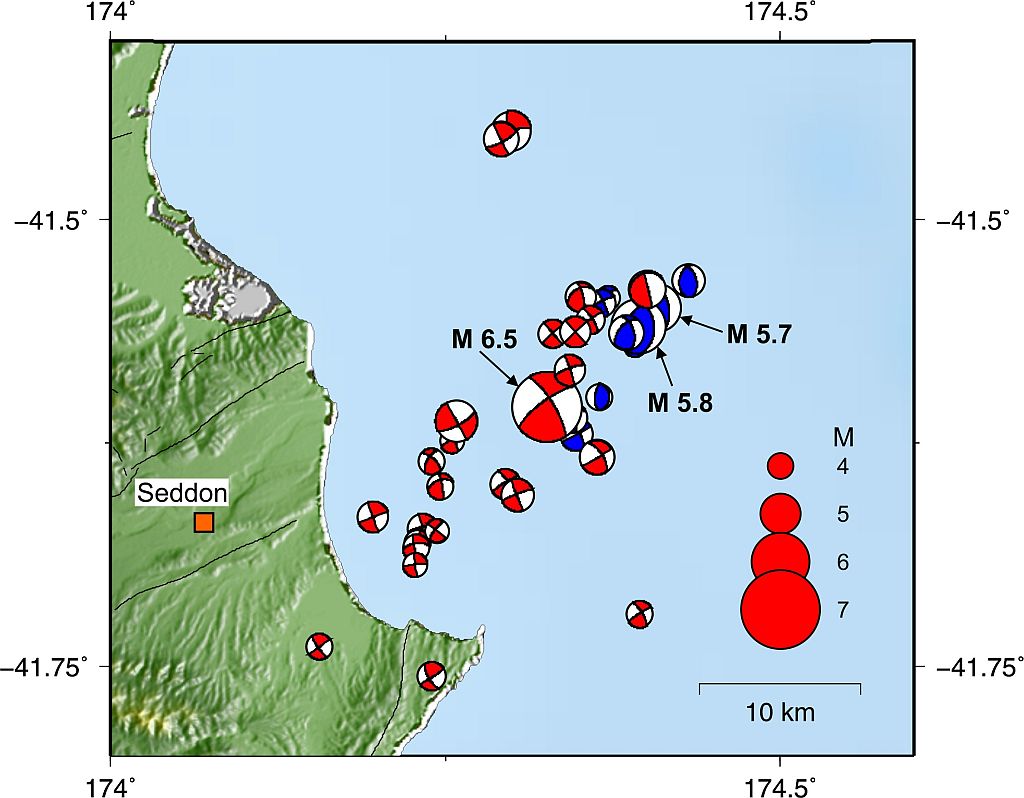
Detail of the inset zone of the Cook Strait focal mechanisms map.
A landslide reconnaissance mission was flown on the morning of Thursday 25 July.
It showed up some significant new failures on the steep coastal cliffs from White Bluff (just east of the Wairau Bar) to Cape Campbell, an area that had failed previously in 1848 and 1855. No other landslides were noted elsewhere (as yet), and no evidence of liquefaction was seen, although some may show up when a more careful inspection of the photos is possible.
On the Wellington side of the strait, aerial photos of the liquefaction damage at the container terminal were taken, and also few small to moderate 'soil slumps' in the large area of fill at the mouth of Kaiwharawhara Stream. So far no failures have been seen on the steep cliffs on the south coast, west of Island Bay, but again some may show up when the photos can be examined more closely.
Engineering
The available strong motion data products for the Cook Strait earthquake, together with plots of seismic waveforms and response spectra, are available from the GeoNet strong-motion site. Through the GeoNet API, a summary information of station peak motions for this event is also available (https://api.geonet.org.nz/intensity/strong/processed/2013p543824).
Aftershock Forecast
A set of possible future scenarios was compiled and released, to better inform both responding agencies and the community.