Gita vs Alison, and the effects on the Kaikoura coast
As another ex-tropical cyclone, Hola, grazed the country this week, we look back a few weeks to one that trampled over the top of us, Ex-Tropical Cyclone Gita, and back even further to Ex-Tropical Cyclone Alison, which hit 43 years ago this week
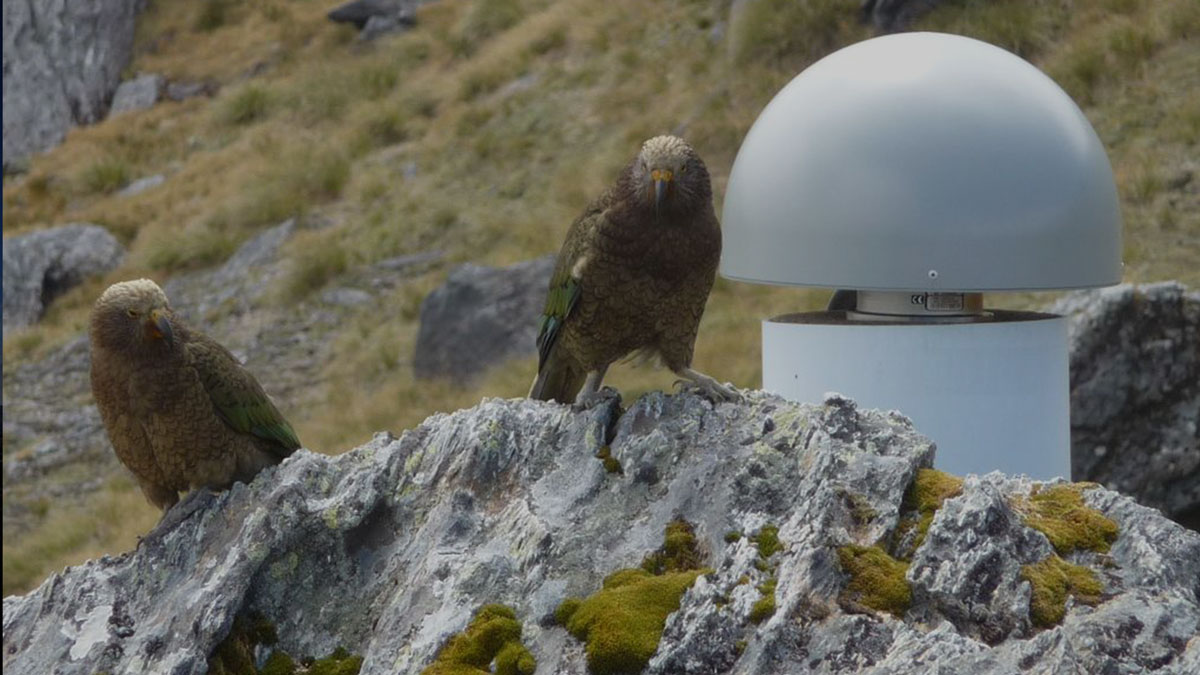
Following on from our Gita story a few weeks ago our landslide scientists were particularly interested in the effects of Cyclone Gita in Kaikoura. Here they are undertaking a multi-year study to better understand how landscapes behave and change in the years after a big earthquake, and how we can best manage the risks from landslides during this time.
The rain
Rainfall during Cyclone Gita was intense along the Kaikoura coast, and one thing our scientists wanted to know was how this compared to Cyclone Alison in 1975. Cyclone Alison was one of the largest storms to hit the South Island last century – there is some fascinating footage of the aftermath on YouTube (it’s worth watching for the flares and classic cars alone).
The maps below show the maximum 1-hour, 12-hour and 24-hour rainfall measurements (shown in brackets) at rain gauges along the Kaikoura coast during Cyclone Gita and Cyclone Alison.
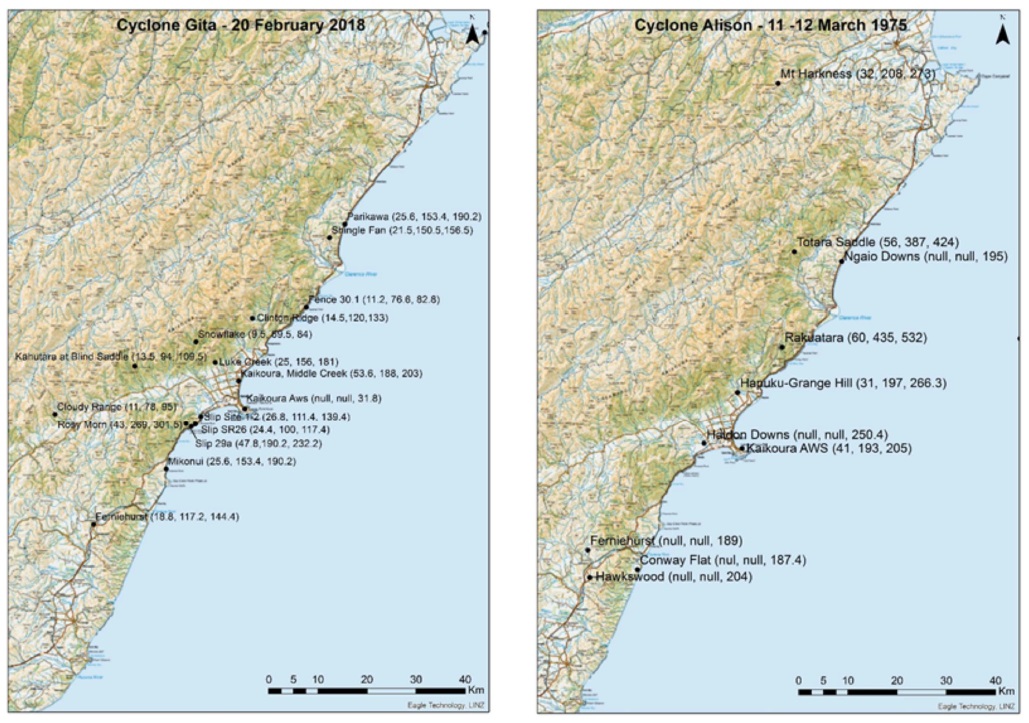
Maps of recorded rainfall during Gita (left) and Alison (right). (Source: NIWA, Environment Canterbury and NCTIR rain gauges.)
Analysis of the rainfall shows that at a few points along the Kaikoura coast, such as Rosy Morn just south of Kaikoura township, Gita rainfall intensities were comparable to Alison. But such extreme rainfall was very localised during Gita, only occurring in a few places, whereas extreme rainfall amounts were seen over a much wider area during Cyclone Alison.
The maximum 1, 12 and 24 hour rainfalls during Cyclone Gita had a 2.5-4% chance of happening in any one year at most locations along the Kaikoura coast - the sort of amounts you might expect a few times in a lifetime. But the rainfall amounts at the Rosy Morn raingauge had a 0.5-1% chance of happening in any one year - the sort of amount you might expect once in a lifetime, if at all.
In comparison, the maximum 1, 12 and 24 hour rainfalls during Cyclone Alison were much higher in most locations with a 0.5-1% chance of happening in any one year - the sort of amount you might expect once in a lifetime. And in some locations, such as Rakautara Stream and Totara Saddle in the Clarence Valley, the rainfall amounts had a 0.3-0.4% chance of happening in any one year - the sort of amount that you might see in a lifetime but probably not.
For those armchair (or real) hydrologist among you, or if you just like graphs, the plots below show the rainfall and return periods at each rain gauges in more detail. Everyone else, scroll down to the landslides!
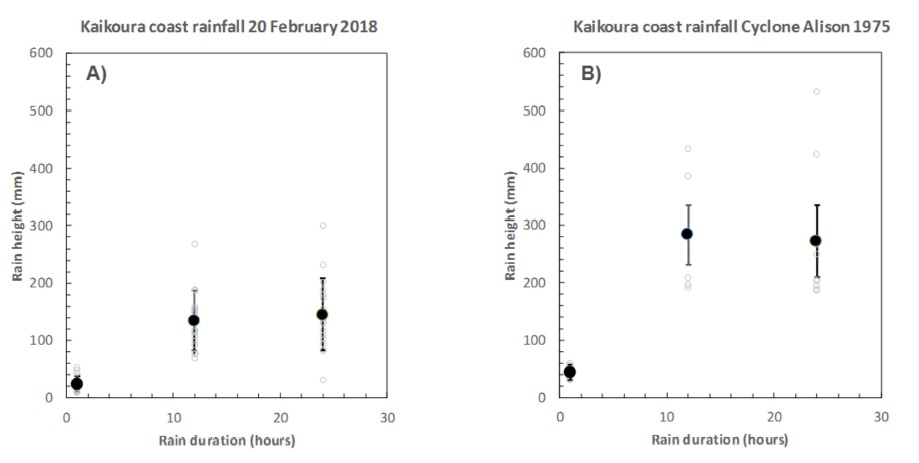
Comparison of Gita (left) and Alison (right) rainfall. (Source: NIWA, Environment Canterbury and NCTIR rain gauges.)
In the plot above, the hollow circles represent each rain gauge record for the given time period, the black circles are the average of all the stations for the given time and the error bars are the standard deviation of the mean.
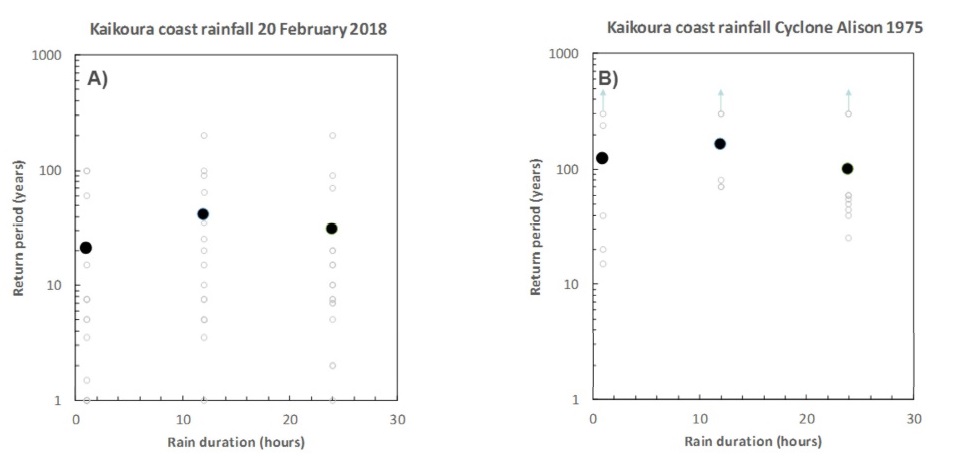
Return period of Gita (left) and Alison (right) rainfall (from the NIWA HIRDS database - values over 100 years should be treated with caution).
This plot shows the return periods, taken from NIWA's High Intensity Rainfall Design System (HIRDS) database, for the rainfall for each time period at each rain gauge. The hollow circles show the return period for the rain recorded at each gauge for each time period, and the black circles are the average return periods for all stations for each time period.
The landslides
The most intense rainfall during Cyclone Gita happened right along the coast, and this was reflected in the location of the landslides that occurred along the coast north and south of Kaikoura.
Most of the Cyclone Gita landslides happened on slopes that had been damaged during the November 2016 M7.8 earthquake – there appear to be very few first-time landslides. And most were debris flows, where rain falling on 2016 landslide scars washed down broken-up debris still sitting on the slopes, or flooding streams picked up 2016 landslide debris sitting in stream beds and gullies. The water ferried this debris downhill to the sea with no regard for what was in between – a road, the rail or houses.
The photos below are before and after shots of a landslide just north of Paparoa Point, north of Kaikoura. The initial landslide on the left was triggered by the 2016 earthquake – note that a lot of the landslide debris is still sitting on the slope and in the channel below. Gita’s rainfall mixed with the debris to make a sloppy rock soup, which covered the highway and rail on its way to the sea. There is still debris left on the landslide and in the channel below, to be scooped up in future storms.
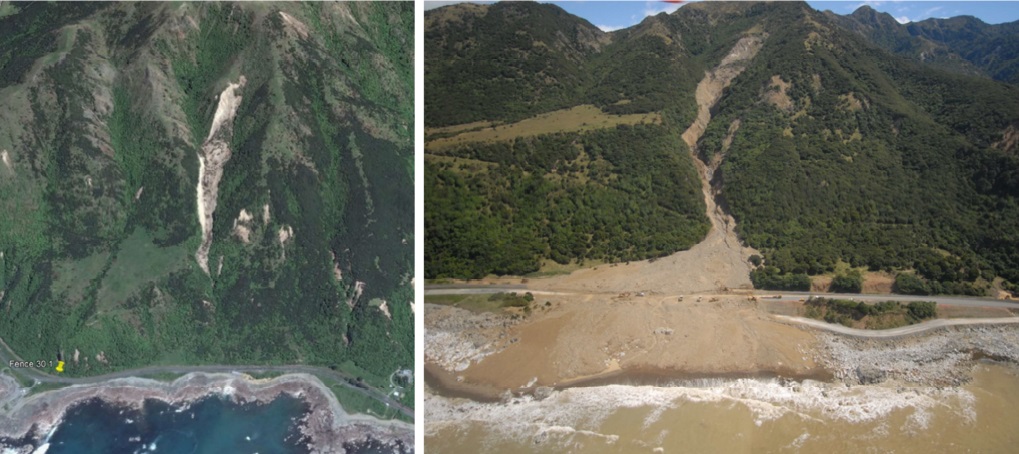
Before and after Gita near Paparoa Point, north of Kaikoura township. (Source: Google Earth and GNS Science.)
Again, the before and after photos below show the slopes above Half Moon Bay north of Kaikoura after the 2016 earthquake, with landside debris sitting on the slopes above State Highway 1, and after Gita with that debris washed down over the road. This entire slope is, in fact, an old pre-2016 landslide.
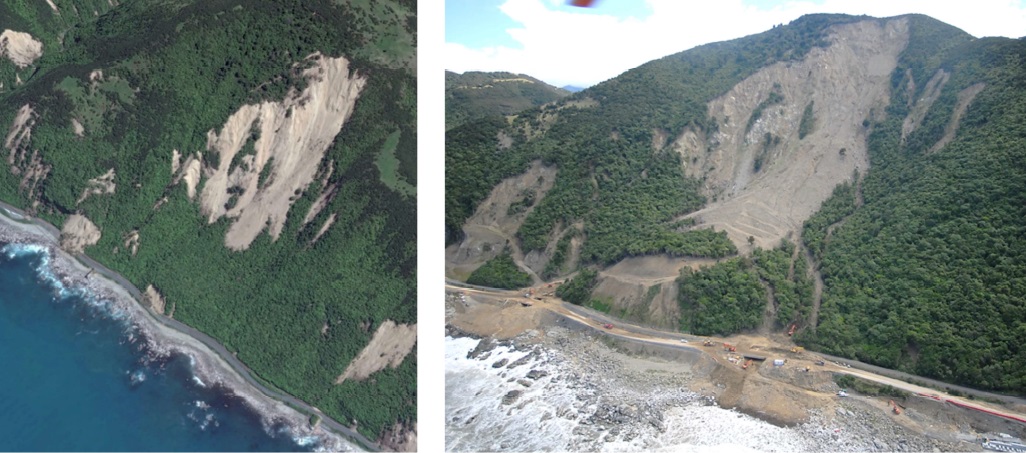
Before and after Gita at Half Moon Bay. (Source: Google Earth and GNS Science.)
The photo below shows the effect of a debris flow on a concrete wall designed to stop rockfalls onto State Highway 1. The wall is designed to manage a smaller volume of dry rock from falling straight onto the road. Fortunately, the sorts of rainfalls that produce these larger debris flows can be forecast and the road closed in advance.
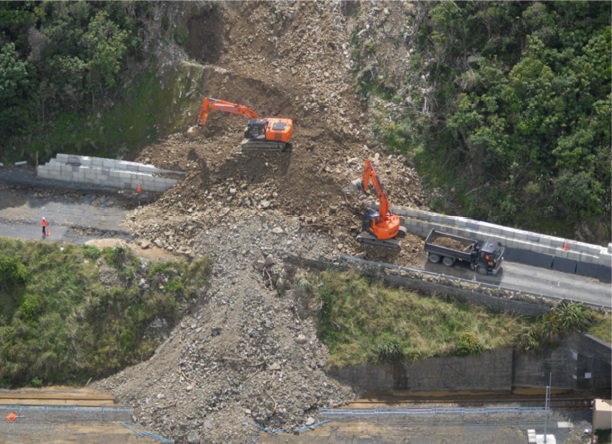
Debris flow over State Highway 1. (Source: GNS Science.)
We also noted that most of the infrastructure and houses damaged by the debris flows were located on pre-existing debris flow or landslide deposits, built up over perhaps hundreds or thousands of years – a reminder that what is below the surface can tell the tales of past events, which can happen again.
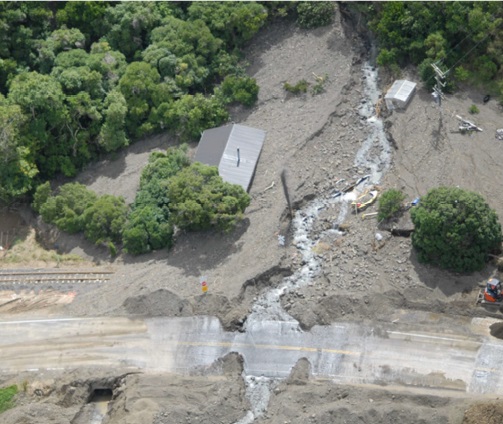
Debris flow at Rosy Morn, south of Kaikoura township. (Source: GNS Science.)
Our landslide scientists are now pulling together all the landslide information for Ex-Tropical Cyclone Gita, including other regions, into a science report. We’ll report back with the findings from that report once it is complete.
Science contacts: Brenda Rosser and Chris Massey, GNS Science.