How GeoNet data collection has grown over time
Welcome, haere mai to another GeoNet Data Blog. Today we are going to talk numbers, specifically numbers showing how our data collection has grown over time. We’ll look into what are the biggest data sets and see how the rate of data growth hasn’t been the same for each data set. Sometimes size matters, and sometimes it doesn’t!
We’ve talked before about data collection, in particular, how often we collect different types of data. While the rate of data collection has a big effect on the total volume of data we collect, data format is also very important as some data takes up more space than others. And, obviously, more field stations mean more data. Today, we aren’t going to bother too much about the whys and wherefores of data volume, instead, we’ll concentrate on the numbers themselves.
Getting the data
All of our data sets available through AWS Open Data can be interrogated to find out exactly how much data we actually have. To find out how much waveform data we collected in 2022, we used this command, using the AWS command line interface (CLI).
aws s3 ls --no-sign-request –-summarize –-recursive s3://geonet-open-data/waveforms/miniseed/2022/
The basics of this command were described in the AWS Open Data blog and the AWS Open Data tutorial.
The two new options are:
-summarize, which means add up the total volume of all the files
-recursive, which means dive into “sub-directories” as required
Normally, you’d also include a “–human-readable” flag, which means provide results in units that are easier to understand. We didn’t do that as we wanted to ensure all results were in units of bytes, rather than a mix of gigabytes, megabytes, and terabytes, making it simpler for our later graphing.
The output of this command lists each of the data files and their size, and then the total number of files and the volume of the files, in bytes. As we are only interested in the total volume, which is the last line of the output, we ignored everything else.
- camera, building and volcano camera images
- coastal, data from tsunami measurement sites installed along the coast
- GNSS, geodetic position data
- environmental, data from the low-rate sensor network, for landslide and volcano observations
- strong-motion, seismic data products
We don’t currently have raw DART data from tsunami measurement sites installed in the deep ocean in AWS Open Data, so we used a similar command referencing an internal data archive.
For some data sets, we collect and store several different kinds of data, for example, GNSS and strong-motion seismic. In these cases, we combined the results to get a single total for each data set for each year.
Waveform data the largest
The waveform data set is by far the largest. This consists of data we collect that is stored in a format called “miniseed”. Most of this data is seismic-waveforms, both “strong-motion” and “weak-motion” seismic-waveform data, but also includes “acoustic-infrasound” data, which monitors air pressure changes at volcanoes. We’ve kept all of this data together and for simplicity, we refer here to this as “waveform data (seismic)”.
High-rate data from coastal gauges used for tsunami monitoring are also in miniseed format, but we’ve separated these out as tsunami wave height data are used quite differently from seismic waveform data. We call this data set “coastal”.
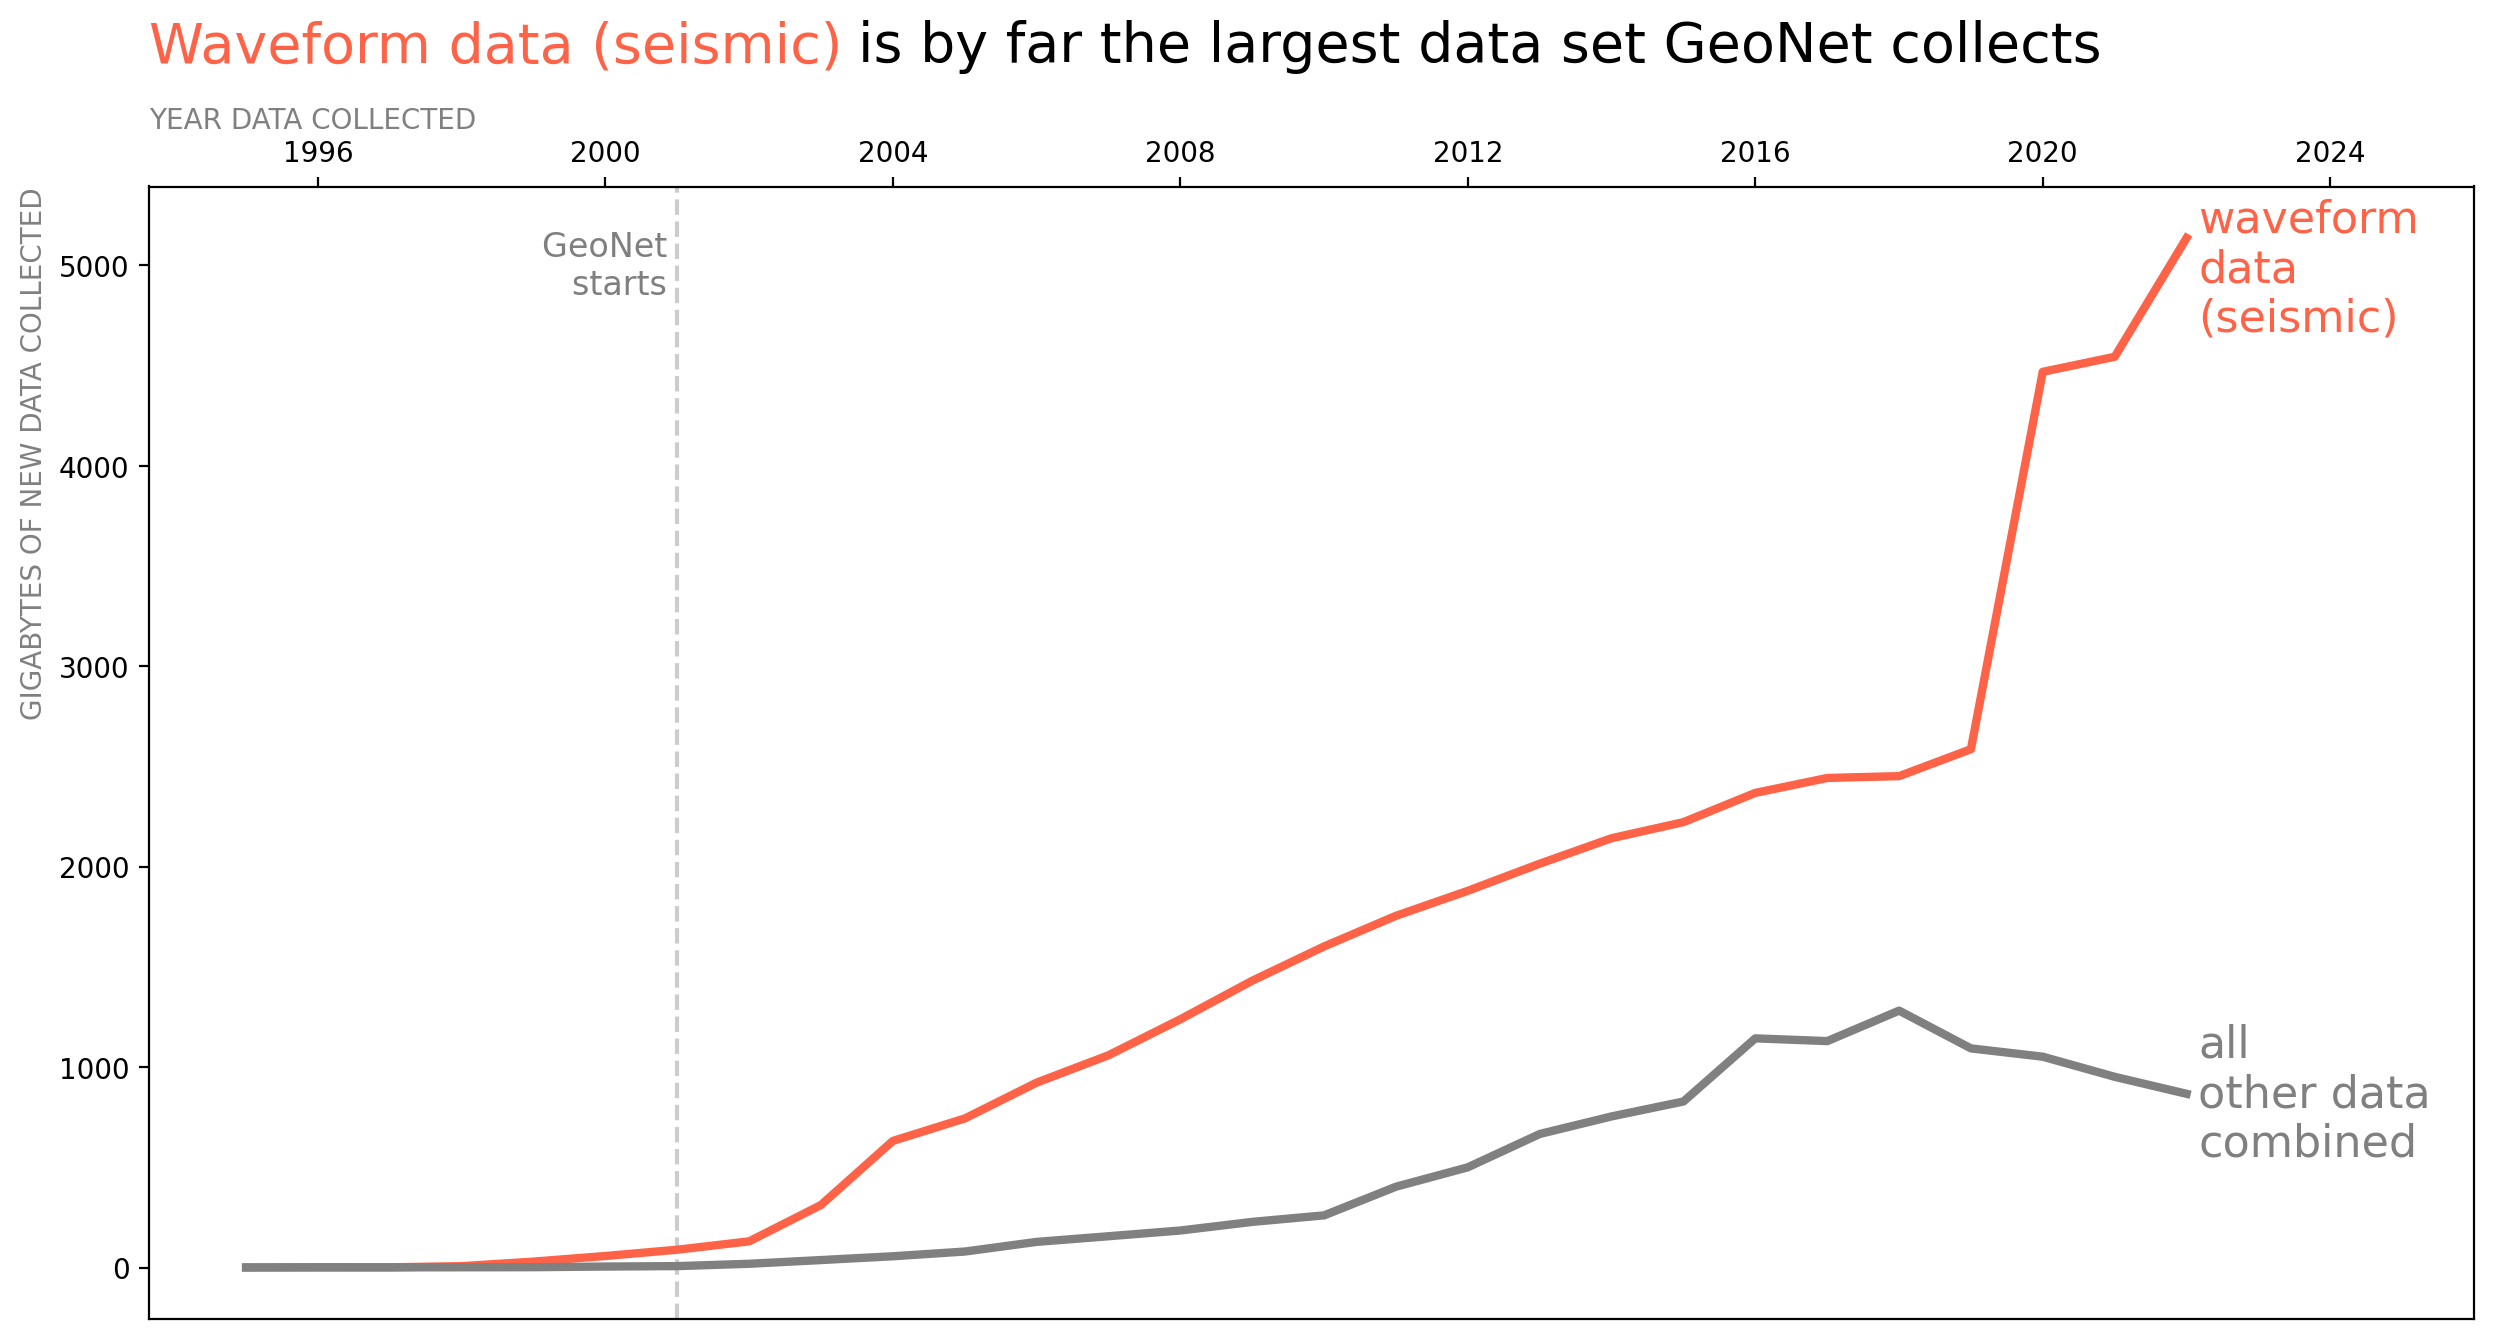
Comparing the annual volume of waveform data (seismic) with the volume of all other data GeoNet collects.
About 5000 gigabytes (GB) of waveform data (seismic) were collected in 2022, about five times the volume of all other data GeoNet collected that year. Apart from its dominance as a data set, there are several Interestingly things to note about the growth of waveform data (seismic).
- The rate of data collection rose following the establishment of GeoNet in 2001, as the monitoring programmed funded the building of the national and regional seismic networks.
- The volume of waveform data (seismic) has increased every year, but not steadily. Since 2019 the data volume has increased more rapidly. Much of this is a result of increasing how often our seismic “strong-motion” data are collected.
Other data sets have vastly different data volumes
The volume of the other data sets GeoNet collects has varied a lot from data set to data set. Some, such as GNSS have been collected as long as waveform data (seismic), and others such as DART and environmental have only begun to be collected more recently.

Comparing the annual volume of all data collected by GeoNet, excluding waveform data (seismic).
GNSS, camera, and strong-motion data sets are the next largest we collect and are much larger than the remaining data sets. The volume of our strong-motion data products, used by earthquake engineers and the like, has varied over time as we’ve tweaked and improved those products.
In the case of GNSS, we collected a lot of data after the 2016 Kaikoura earthquake. In 2019, we changed to a different data format when we had a major upgrade of the GNSS data collection system.
As well as archiving an “open” data format used for analysis of ground movements, we also decided to archive the raw, “proprietary” data format recorded by the GNSS receivers. This ensures we can always recreate the “open” data format any time in the future.
At the same time, we increased how we compress the open data format in our archive so that it took up less space. Although it looks like we collected less data, we just stored it more efficiently!
The annual volume of camera data grew fairly steadily until 2019 but has declined since then. In 2019, we stopped collecting images of the Christchurch CBD rebuild after the 2011 Christchurch earthquake and following the 2019 Whakaari/White Island eruption there has been a gradual failure of cameras on the island as we have not been able to visit to perform necessary maintenance.
It’s not all about size
While we’ve pointed out that waveform data (seismic) are by far the largest data set GeoNet collects, it doesn’t mean it’s the only important data set. Some of the smaller data sets are just as valuable, it is just that they are smaller. Some of those haven’t been collected for as long, aren’t collected from as many locations, or are collected at a lesser rate, so the total volume is a lot smaller. But some are growing in volume faster than waveform data (seismic), reflecting our application of new technology to monitoring and assessing geohazards in Aotearoa New Zealand.
To get a more even view, here is how each of the data sets has grown relative to what we collected in 2022. This also shows which data sets have been collected for a long time, and which are more recent additions.

The growth of each of GeoNet’s data sets relative to how much data was collected in 2022.
That’s it for now
We’ve previously talked about data collection rates, today we’ve looked at data volumes and how they’ve varied. The other part of the complete story is data formats as that is related to collection rate and directly influences data volume. A blog on that subject is something we intend to do in the not-too-distant future. You can find our earlier blog posts through the News section on our web page just select the Data Blog filter before hitting the Search button.
We welcome your feedback on our data blogs and if there are any GeoNet data topics you’d like us to talk about please let us know! Ngā mihi nui.
Contact: info@geonet.org.nz