Kaikōura two years on: How have the aftershocks played out?
It was New Zealand’s most complex earthquake ever recorded, with more than 20 faults rupturing. Our seismologists have prepared aftershock forecasts for the region since the quake. So, two years on, how are they stacking up?
Earthquake forecasts have become a standard part of the GeoNet response to major earthquakes since the 2010/2011 Canterbury quakes. They provide the probability of an earthquake happening in a certain area over a defined period of time. These forecasts are helpful because they give people an understanding of what aftershocks they could expect and the probability of them occurring, also what ground shaking they can expect at their location.
We can’t yet scientifically predict earthquakes, but scientists can use probabilities to forecast future aftershocks. Most earthquake aftershock sequences decay over time, meaning the number of earthquakes decreases. This is called the Omori Law. We have observed though, that this decay can include spikes of activity that include larger earthquakes, such as what happened in Canterbury
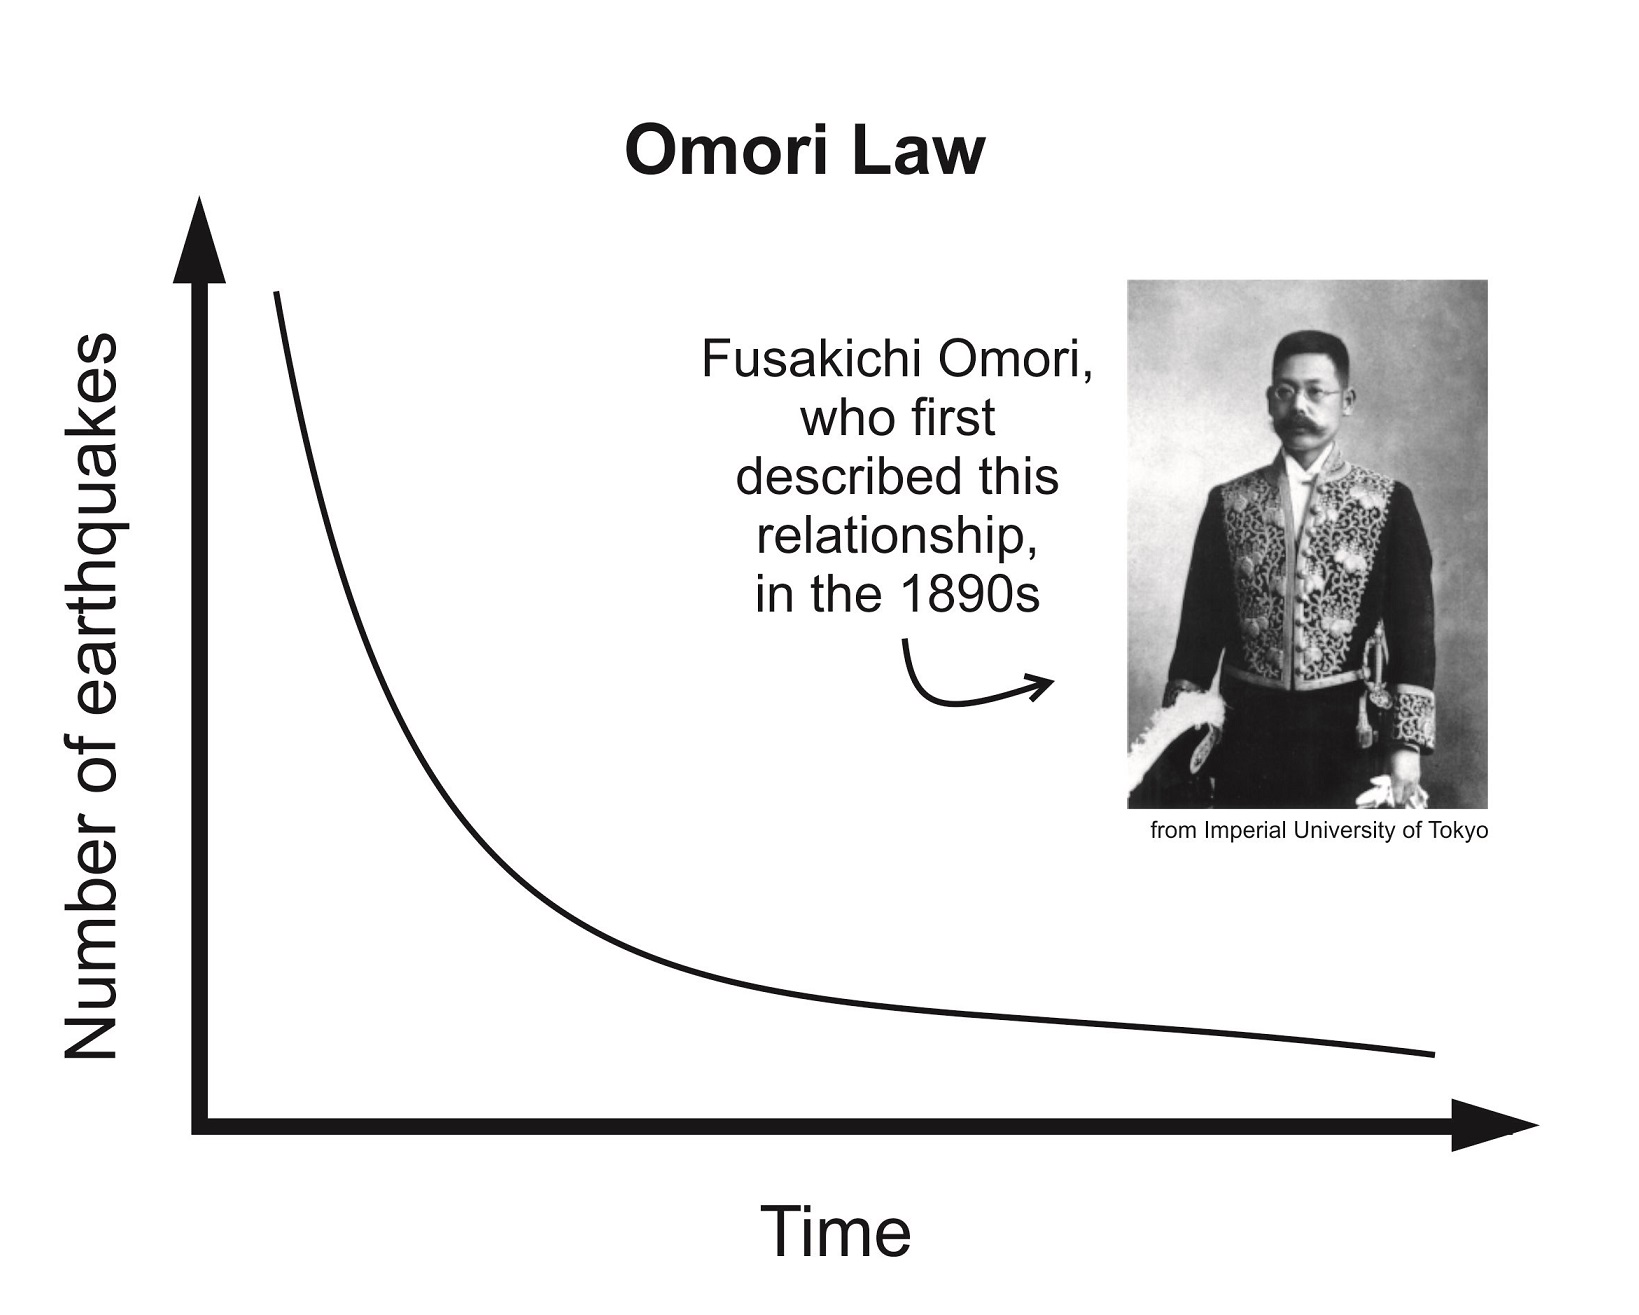
Omori Law
New Zealanders have had experience with a drawn-out aftershock sequence following the Canterbury quakes, and it was expected that the sequence following the Kaikōura quake could be similar given the severity and complexity of the quake. GNS Science earthquake hazard modellers put out updated aftershock forecasts frequently at first, and then changed from daily to weekly to monthly and so on.
But seismologists also noticed the Kaikōura aftershock sequence was dropping off more rapidly than the Canterbury sequence. This quicker decay in aftershocks demonstrates each earthquake event is unique, and it’s difficult to determine how an aftershock sequence is going to play out long-term.
In the first year after the quake (to 14 Nov 2017), there were more than 19,000 recorded aftershocks. In year two, there were just over 4500 aftershocks, and only 265 were over magnitude 3. This is only a quarter of the aftershocks of the previous year. You can use our Quake Search tool on the website if you want to search our catalogue of earthquakes.
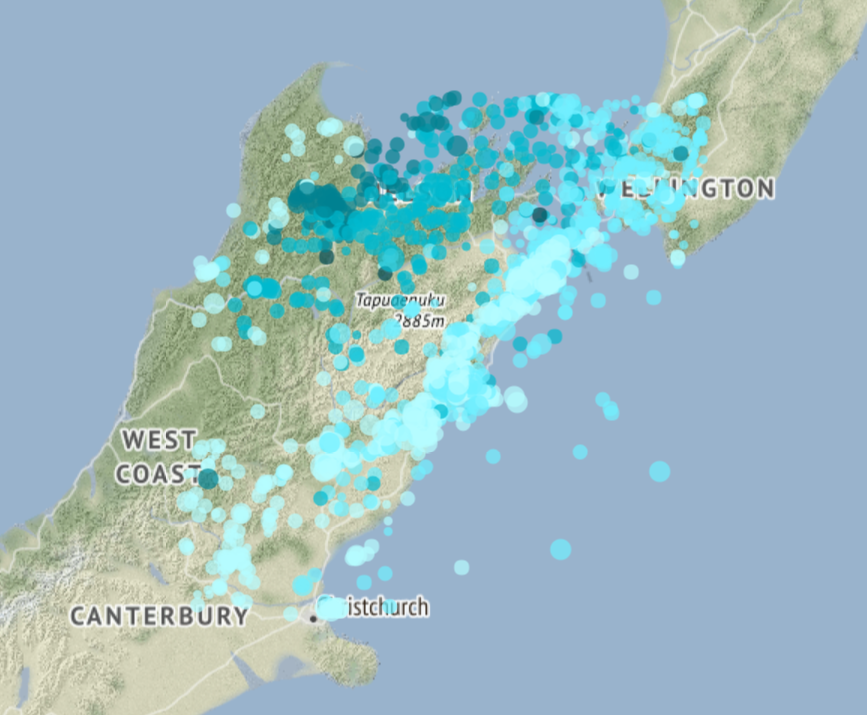
Some of the Kaikōura aftershocks from 14/11/17-14/11/18
The Kaikōura aftershock forecast model has been updated for the forecasted region on 14 Nov 2018. You can access that here. There is now a 15% chance of one or more M6.0-6.9 earthquakes occurring within the next three months (in the forecasted area, marked by a red box – see graphic below). In comparison the forecast model made the day after the quake (15 Nov 2016) gave a 91% chance of a M6.0-6.9 earthquake happening in the next 30 days in the forecasted area.
The latest annual forecast for one or more M6.0-6.9 earthquakes has decreased to 44% as of 14 Nov 2018.
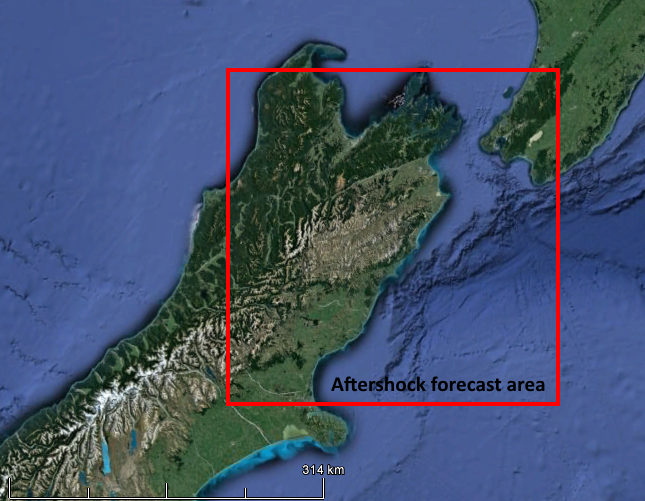
aftershock probability map
“The aftershock forecast continues to decay, as we would expect after a major earthquake,” as observed by Dr Annemarie Christophersen, Hazard and Risk Scientist at GNS Science.
Dr Matt Gerstenberger, GNS Science Seismologist, agrees and points out the sequence is currently generating fewer aftershocks than “average” aftershock behaviour.
“In our forecasts we use a range of models, some of which match what has happened and others that account for the potential for the rate of aftershocks to increase in the future,” Dr Gerstenberger says. “The rate is likely to continue to decay as it has been.”
We’ve posted an update article every day this week to mark the two-year anniversary of the Kaikōura quake. You can access these here:
Kaikōura two years on: The changed landscape
Kaikōura two years on: Playing the long game with landslides